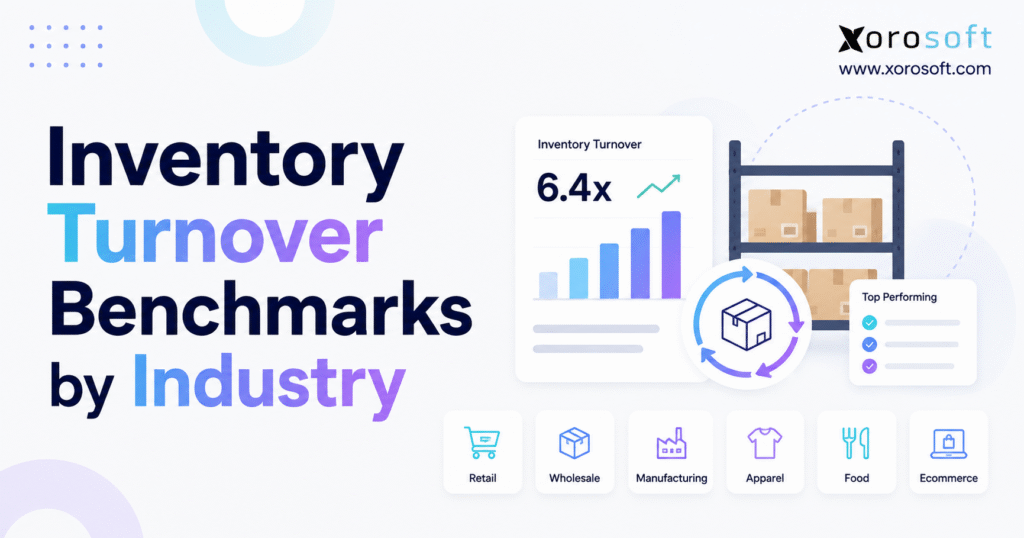
If you’re looking to compare your business performance, understanding inventory turnover benchmarks by industry can provide valuable insights.
1. Why Industry Context Matters Before You Chase Higher Inventory Turns
Inventory turnover looks simple on a dashboard, yet it is one of the easiest inventory metrics to misinterpret. A company sees four turns, checks an online benchmark that says six, and concludes that purchasing must cut stock. Six months later, fast-moving products are unavailable, supplier expedites have increased, and the improvement in the headline ratio has come at the expense of customer service.
The problem is not the metric. The problem is using inventory turnover without understanding the operating model behind it.
Inventory turnover benchmarks by industry vary because inventory plays a different role in every sector. A grocery distributor handling perishable products may need inventory to move rapidly. Furniture companies, on the other hand, often carry larger, higher-value products with longer sourcing cycles. Apparel companies must plan around style, color, size, seasonality, and markdown risk, while manufacturers may hold raw materials, work in process, and finished goods at the same time.
Even two businesses in the same industry can require different targets. A wholesale distributor promising same-day availability across thousands of service parts may intentionally hold more inventory than a competitor operating a make-to-order model. Likewise, an ecommerce brand sourcing domestically can replenish differently from one importing containers with 90-day lead times.
For that reason, inventory turnover benchmarks by industry should function as reference points, not hard targets.
The stronger operating question is not simply, “How high can we push inventory turnover?” It is:
How efficiently can we use inventory while protecting availability, margin, service levels, and supply-chain resilience?
That distinction matters because inventory turnover affects much more than warehouse space. It influences cash flow, purchasing capacity, markdown exposure, obsolescence, supplier planning, fulfillment, and ultimately profitability.
2. How Inventory Turnover Is Calculated and What the Ratio Actually Measures
Inventory turnover measures how many times a business effectively sells or consumes its average inventory during a defined period, usually one year.
The standard calculation uses cost rather than selling price:
Inventory Turnover Ratio = Cost of Goods Sold ÷ Average Inventory
Shopify’s inventory guidance uses the same COGS-based approach because inventory sits on the balance sheet at cost rather than at retail selling price.
2.1 Inventory Turnover Formula With a Practical Example
Suppose a distributor reports annual cost of goods sold of $6 million. Beginning inventory was $1 million, while ending inventory was $1.4 million.
First, calculate average inventory:
Average Inventory = ($1,000,000 + $1,400,000) ÷ 2 = $1,200,000
Next:
Inventory Turnover = $6,000,000 ÷ $1,200,000 = 5 turns
The business therefore moved an amount equivalent to its average inventory roughly five times during the year.
That does not mean every SKU turned exactly five times. Some products may have turned 15 times, while others barely moved. Company-wide turnover shows financial efficiency, but category- and SKU-level analysis explains what caused the result.
2.2 Why Average Inventory Matters
Using only ending inventory can distort the ratio.
Consider an apparel company that builds inventory heavily before the holiday season. If the financial year ends immediately after a major inventory build, ending stock may be unusually high and turnover may appear weaker than normal.
Fast-growing businesses face the opposite problem. Their ending inventory may substantially exceed beginning inventory because revenue and SKU count expanded during the year.
In these situations, monthly average inventory generally provides a better representation than simply averaging the first and last day of the year.
2.3 Convert Inventory Turns Into Inventory Days
Operators often find days on hand easier to interpret.
Use:
Approximate Inventory Days = 365 ÷ Inventory Turnover
A business operating at two turns carries roughly 183 days of inventory. Four turns equal about 91 days, six turns equal approximately 61 days, eight turns translate to roughly 46 days, and 12 turns represent about 30 days.
Turnover and inventory days therefore describe the same operating reality from opposite directions.
2.4 COGS-Based Turnover Is Not the Same as an Inventory-to-Sales Ratio
This distinction matters when researching inventory turnover benchmarks by industry.
The U.S. Census Bureau publishes inventory-to-sales ratios for manufacturers and wholesalers. For June 2026, the seasonally adjusted merchant wholesaler inventory-to-sales ratio stood at 1.19. That metric compares end-of-month inventory with monthly sales; it is not annual COGS divided by average inventory.
Both metrics are useful, but comparing them directly creates misleading conclusions.
3. Inventory Turnover Benchmarks by Industry: 2026 Reference Ranges
No single government database establishes the correct annual inventory turns for every operating model. Therefore, the following inventory turnover benchmarks by industry should be treated as directional planning ranges rather than mandatory targets.
They help answer whether a company’s inventory velocity appears broadly aligned with its sector. After that first comparison, managers should narrow the benchmark by business model, product category, margin structure, service level, and supplier characteristics.
| Industry / Business Model | Directional Annual Turns | Approx. Inventory Days | Typical Inventory Challenge |
|---|---|---|---|
| Grocery / Fresh Food | 14–20× | 18–26 | Perishability and frequent replenishment |
| General / Specialty Retail | 4–8× | 46–91 | Assortment balance and stock availability |
| Ecommerce / DTC | 6–10× | 37–61 | Channel demand and fulfillment availability |
| Wholesale Distribution | 5–10× | 37–73 | MOQs, long-tail SKUs and service levels |
| Apparel / Fashion | 3–6× | 61–122 | Seasonality, variants and markdown exposure |
| Furniture / Home Décor | 2–5× | 73–183 | Bulky stock and longer purchasing cycles |
| Sporting Goods | 3–7× | 52–122 | Seasonal demand and assortment complexity |
| Food Manufacturing | 5–8× | 46–73 | Shelf life, ingredients and production planning |
| General Manufacturing | 4–8× | 46–91 | Raw materials, WIP and finished goods |
| Automotive Parts | 3–6× | 61–122 | Large SKU catalogs and long-tail demand |
| Industrial Distribution | 4–7× | 52–91 | Lead times, MOQs and service inventory |
| Consumer Electronics | 5–10× | 37–73 | Obsolescence and product refresh cycles |
| Beauty / Personal Care | 5–10× | 37–73 | Replenishment and assortment management |
Netstock’s current benchmark research illustrates why ranges are more useful than one universal number. Among North American companies in its high-performing cohort, manufacturing averaged 5.6 stock turns, retail 5.7, and wholesale 6.4. Its lower-performing cohorts were much closer to roughly two annual turns.
Those numbers provide strong operating context, but they still do not mean every manufacturer should target exactly 5.6 turns.
3.1 Why Inventory Turnover Industry Averages Can Differ Between Sources
Three factors create most benchmark disagreement.
First, datasets include different companies. A public-company database may contain billion-dollar retailers, while an SMB planning benchmark focuses on privately held businesses.
Second, categories are often too broad. “Retail” can include grocery, apparel, sporting goods, luxury products, and furniture. Those businesses should not carry inventory the same way.
Third, the formulas may differ. Some sources calculate cost-based turnover. Others publish sales-to-inventory or inventory-to-sales measures.
Consequently, inventory turnover benchmarks by industry become more reliable when the methodology is visible rather than hidden behind one headline figure.
4. Inventory Turnover Benchmarks by Industry for Major Inventory-Driven Sectors
The most useful benchmark is the one closest to the way a company actually operates. Looking at the characteristics of each sector helps explain why otherwise healthy ratios can vary significantly.
4.1 Retail Inventory Turnover Benchmarks
Retailers typically need to balance two competing priorities: carrying enough stock to protect sales while avoiding an assortment filled with products customers are no longer buying.
A directional range of four to eight annual turns can provide a starting point for many general and specialty retailers. However, category-level analysis matters far more than the company average.
A retailer with six turns overall may still have one category turning 12 times and another turning twice. Unless managers examine those differences, purchasing teams may keep replenishing slow sellers while high-demand products continue to stock out.
Current Netstock benchmark data make the performance gap visible. Its North American high-performing retail cohort recorded 5.7 stock turns versus 2.3 among the lower-performing group.
4.2 Ecommerce and DTC Inventory Turnover Rates
Ecommerce brands often target faster inventory velocity because products can reach a large customer base without requiring stock in individual retail stores.
Still, online selling creates its own inventory problems.
Shopify, marketplaces, wholesale orders, and multiple fulfillment locations may all compete for the same products. Rapid growth can also disguise poor purchasing. Revenue climbs, so buying climbs with it, yet aging inventory quietly accumulates behind the bestselling SKUs.
For many ecommerce and DTC businesses, six to ten turns can serve as a directional range. The better benchmark, however, separates replenishable core items from seasonal launches, limited products, and slow-moving variants.
4.3 Wholesale Distribution Inventory Turnover Benchmarks
Wholesale distributors often need broader assortments than retailers because customer service depends on product availability across many SKUs.
A directional five-to-ten-turn range provides useful context, while Netstock’s North American high-performing wholesale cohort reached 6.4 turns.
Yet wholesale inventory strategy depends heavily on supplier terms.
High minimum order quantities can force distributors to buy beyond current demand. Long overseas lead times increase safety stock. EDI customers may expect guaranteed inventory allocations, while large accounts can create irregular order patterns that standard forecasts struggle to predict.
Current Census data reinforce that wholesale categories behave differently. In June 2026, the seasonally adjusted inventory-to-sales ratio was 0.72 for grocery wholesalers, 1.58 for furniture and home furnishings, and 2.70 for machinery, equipment, and supplies. Again, those are monthly inventory-to-sales ratios rather than annual inventory turns, but they clearly show differences in inventory intensity between categories.
4.4 Apparel and Fashion Inventory Turnover Benchmarks
Apparel inventory becomes difficult because a single style can multiply into dozens of color and size combinations.
A broad directional range of three to six turns may suit many apparel businesses, although fast-fashion formats can operate faster.
The real operating risk is not simply slow turnover. It is late recognition of slow turnover.
Once a seasonal style reaches the end of its selling window, managers may have few options other than markdowns, outlet channels, liquidation, or carrying inventory into another season. For that reason, apparel brands should monitor aging, sell-through, demand by size, and stock by color alongside turnover.
4.5 Furniture and Home Décor Inventory Turnover
Furniture companies commonly operate at slower rates because products consume more cash and warehouse space per unit.
A sofa that remains in inventory for 100 days can still be economically acceptable if margins are strong and demand is stable. The same 100-day holding period for a short-life consumer product may signal a serious problem.
Imported furniture adds another layer. Long lead times and container economics often encourage larger orders, which increases inventory exposure. Consequently, managers should evaluate turns alongside container planning, supplier reliability, warehousing cost, and gross margin.
4.6 Food and Beverage Inventory Turnover Benchmarks
Food businesses face a constraint that many other sectors do not: inventory can lose value simply because time passes.
Fresh products generally require rapid turnover. Packaged foods, beverages, frozen items, and ingredients can operate with longer cycles, although shelf-life and lot requirements still matter.
As a result, turnover should connect directly with expiry dates, lot tracking, forecast accuracy, production planning, and FEFO picking policies where appropriate.
A product may technically remain sellable for another 90 days, but wholesale customers might refuse to accept it if their minimum shelf-life requirement is 120 days. That practical constraint effectively shortens the usable inventory window.
4.7 Manufacturing Inventory Turnover Benchmarks
Manufacturing requires more careful analysis because total inventory usually combines several economically different pools.
A directional four-to-eight-turn range may provide high-level context, while Netstock’s stronger North American manufacturing cohort recorded 5.6 annual stock turns.
However, managers should separate raw materials, work in process, and finished goods.
Raw materials may accumulate because procurement overbuys or suppliers impose large MOQs. Excess WIP can indicate scheduling constraints or production bottlenecks. Finished goods may turn slowly because forecasts or production quantities exceed actual demand.
One aggregate ratio cannot identify which layer created the problem.
4.8 Sporting Goods, Automotive Parts, and Industrial Distribution
These sectors frequently carry long-tail assortments.
Some SKUs sell every day. Others move only a few times annually but remain important because customers expect them to be available.
That makes purely velocity-based inventory reduction dangerous.
Service parts are a good example. A component may turn slowly but prevent a major customer’s equipment from remaining out of service. Its economic value therefore includes customer retention and service capability, not just annual turns.
This is why inventory turnover benchmarks by industry should never replace commercial judgment.
5. Why Healthy Inventory Turnover Varies So Much Between Businesses
Two competitors can report different turnover ratios and both run healthy operations.
The first may source locally, purchase weekly, and operate one warehouse. The second imports from Asia, orders in containers, carries customer-specific stock, and serves four distribution centers.
Their inventory requirements will naturally differ.
5.1 Supplier Lead Time Changes the Amount of Inventory a Business Needs
Longer lead times usually require more stock because replenishment cannot arrive quickly enough to correct forecast errors.
If a supplier consistently delivers within seven days, planners can react to demand changes. When supply requires 90 days, managers must commit much earlier and protect against greater uncertainty.
5.2 Minimum Order Quantities Can Suppress Inventory Turnover
Purchasing economics often conflict with inventory efficiency.
A supplier may offer attractive pricing only at 5,000 units even though expected demand over the next few months is 3,000 units. The lower unit cost looks appealing, but the additional 2,000 units consume cash and warehouse capacity.
Netstock’s benchmark research identifies supplier constraints and order quantities as material inventory-planning issues for SMBs.
5.3 Margin Changes the Economics of Slow-Moving Inventory
Companies should not optimize turnover without considering gross margin.
A low-margin distributor needs inventory to work hard because each sale generates a relatively small contribution. Meanwhile, a high-margin specialty business may tolerate slower turns because each successful sale produces more gross profit.
That is why GMROI can add valuable context to inventory turnover benchmarks by industry.
5.4 Service Levels Can Justify Slower Turns
Availability itself can be part of the product.
Industrial distributors, spare-parts businesses, and certain wholesalers compete partly on their ability to supply customers immediately.
In those environments, cutting every slow-moving item may improve turnover mathematically while damaging the reason customers buy from the company.
6. What High, Healthy, and Low Inventory Turnover Actually Tell You
The turnover ratio is a signal, not a diagnosis.
Low turnover usually deserves investigation, but high turnover can also reveal a problem.
6.1 Low Inventory Turnover
A persistently low ratio often points to excess purchasing, forecasting errors, weak assortment management, oversized safety stock, high MOQs, obsolete products, or inventory sitting in the wrong location.
It also places pressure on working capital because cash remains tied up in products for longer periods.
However, managers should identify exactly where slow inventory exists before reducing purchase quantities.
6.2 Healthy Inventory Turnover
Healthy turnover means inventory moves at a rate that supports demand without creating unnecessary stock.
That definition intentionally includes customer service.
If a business holds slightly more inventory than its industry average but consistently meets customer commitments, avoids emergency freight, protects margin, and generates acceptable returns on working capital, its position may be entirely rational.
6.3 Excessively High Inventory Turnover
Very high turnover can indicate strong demand and excellent replenishment. It can also indicate chronic understocking.
Managers should examine fill rate, lost sales, stockouts, backorders, lead times, and expedited purchases before celebrating a rapidly rising turnover ratio.
The objective is not maximum inventory turns. It is the best balance between velocity and availability.
7. How to Use Inventory Turnover Benchmarks by Industry Correctly
The strongest benchmarking process moves from broad comparisons toward increasingly specific operating data.
Start with inventory turnover benchmarks by industry to establish context. Next, compare your current result with historical performance. After that, narrow the analysis to categories, SKUs, warehouses, and channels.
7.1 Compare Against Your Own Historical Trend
A company moving from 3.1 to 4.0 turns may be improving significantly even if a published sector benchmark is five.
Historical analysis reveals whether inventory discipline is moving in the right direction.
Rolling 12-month turnover is particularly useful because it reduces seasonal noise while still responding to meaningful changes in inventory levels and COGS.
7.2 Benchmark Product Categories Separately
Company-wide turnover can conceal major imbalance.
Suppose a consumer-goods business reports six turns overall. Personal care products turn 11 times, household products turn seven, and one accessory category turns only once.
The company does not have a general inventory-turnover problem. It has a category-specific problem.
That distinction changes the action.
7.3 Measure Inventory Turnover by SKU
SKU analysis exposes the actual inventory drivers.
Fast movers may need higher service levels and more reliable reorder logic. Slow movers may require smaller purchase quantities, reduced safety stock, promotions, vendor negotiations, or eventual discontinuation.
Instead of applying one turnover target to every product, segment inventory according to economic importance and demand behavior.
7.4 Measure Turnover by Warehouse
Multi-warehouse businesses often hold too much total inventory because stock is distributed incorrectly.
A product may be unavailable on the West Coast while months of supply sit in an eastern warehouse. Company-wide availability looks sufficient, but customers still experience shortages.
Warehouse-level analysis separates true supply shortages from allocation problems.
8. Inventory Turnover Versus DIO, Sell-Through, GMROI, and Inventory Aging
No single KPI explains inventory performance completely. Inventory turnover benchmarks by industry become much more useful when managers compare them with complementary metrics.
| KPI | What It Answers | Primary Use |
|---|---|---|
| Inventory Turnover | How often does inventory move? | Overall inventory efficiency |
| DIO / Inventory Days | How long does inventory stay on hand? | Working-capital planning |
| Sell-Through | What percentage of available stock sold? | SKU or collection performance |
| GMROI | How much gross margin does inventory generate? | Inventory profitability |
| Inventory Aging | How long has specific stock remained unsold? | Slow-moving and obsolete stock |
| Stockout Rate | How often are products unavailable? | Service-level protection |
8.1 Inventory Turnover Versus Days Inventory Outstanding
Turnover expresses movement as frequency. DIO expresses the same general condition as time.
A finance leader may prefer DIO because it connects naturally with working-capital planning. Operations teams may find annual turns more intuitive when comparing categories.
8.2 Inventory Turnover Versus Sell-Through
Sell-through works particularly well for seasonal products, product launches, and collections.
For example, an apparel buyer may want to know what percentage of a new spring collection sold within eight weeks. Annual inventory turnover is too broad for that decision.
8.3 Inventory Turnover Versus GMROI
Turnover says nothing directly about margin.
One SKU might turn 10 times annually but generate thin margins. Another may turn four times yet generate substantially more gross profit relative to the capital invested.
Both metrics should influence assortment decisions.
9. Why Inventory Turnover Falls as Businesses Scale
Many companies assume inventory efficiency will automatically improve with revenue. In practice, growth often does the opposite.
More sales usually introduce more SKUs, suppliers, warehouses, channels, purchasing decisions, and exceptions.
9.1 Purchasing Teams Lose a Single View of Demand
A buyer may check Shopify orders, another spreadsheet for wholesale forecasts, warehouse balances in an inventory app, and supplier information in email.
Each system can be accurate independently while the overall purchasing picture remains fragmented.
As a result, buyers create extra buffers because they do not trust the data.
9.2 More Warehouses Often Mean More Safety Stock
Adding locations improves customer proximity but can multiply inventory requirements.
If every warehouse independently holds safety stock for every SKU, total inventory may rise much faster than revenue.
Network-level replenishment and transfers become increasingly important.
9.3 Growth Creates More Slow-Moving Inventory
Expanding assortments feels like progress, but every added SKU introduces another forecasting decision.
Unless companies routinely review assortment productivity, old products remain active and buyers keep replenishing them.
Eventually, inventory turnover declines even while sales rise.
10. How to Improve Inventory Turnover Without Creating Stockouts
The safest way to improve turnover is through precision rather than broad inventory cuts.
10.1 Improve Forecast Accuracy Before Cutting Stock
Demand forecasts should separate recurring demand from promotions, large one-time orders, seasonal peaks, and new-product effects.
The objective is not perfect forecasting. It is reducing systematic error enough that purchasing teams can carry smaller buffers with confidence.
10.2 Review Reorder Points and Safety Stock
Old planning parameters quietly create excess inventory.
Supplier lead times change. Demand changes. Service priorities change. Yet many systems continue using reorder points established years earlier.
Regular parameter reviews can release inventory without sacrificing availability.
10.3 Attack Slow Movers Early
Once inventory becomes obsolete, options narrow quickly.
An aging review should identify products while managers can still reduce reorders, change promotions, move stock between channels, negotiate returns, bundle items, or modify pricing.
Early action usually protects more margin than late liquidation.
10.4 Rebalance Inventory Before Reordering
Multi-warehouse businesses should check network availability before creating another purchase order.
A transfer may cost more operationally than doing nothing, but it often costs much less than buying additional stock while identical inventory remains idle elsewhere.
10.5 Improve Supplier Terms
Supplier negotiations should include more than price.
Smaller MOQs, shorter lead times, more frequent deliveries, vendor-held inventory, better delivery reliability, and improved purchase flexibility can all support higher inventory turnover without reducing availability.
11. Multi-Warehouse and Ecommerce Complexity Changes the Inventory Turnover Equation
Turnover becomes harder to manage when a company sells through several channels and fulfills from multiple locations.
11.1 Inventory Accuracy Comes Before Inventory Optimization
A turnover calculation based on inaccurate inventory cannot guide good decisions.
Cycle counts, receiving discipline, picking accuracy, adjustments, transfers, and location control all influence the quality of the inventory balance.
For businesses operating increasingly complex warehouse networks, XoroWMS provides a warehouse-focused path for managing inventory movement and execution within the broader Xorosoft ecosystem.
11.2 Channel Connectivity Helps Prevent Hidden Inventory Buffers
Shopify, Amazon, wholesale, EDI, and other channels may all compete for the same inventory.
When channel data remain disconnected, businesses often protect themselves by carrying more stock.
A connected integration environment can reduce that uncertainty by improving the flow of order and inventory information across systems.
For Shopify merchants specifically evaluating the ERP connection, the Xorosoft ERP listing in the Shopify App Store provides additional context on how the ecommerce connection fits into the operating stack.
11.3 Multi-Warehouse Turnover Should Be Measured at Two Levels
Network-level turnover answers whether total inventory investment is productive.
Warehouse-level turnover answers whether inventory sits in the right place.
Both matter.
A company can achieve an acceptable global ratio while still carrying large imbalances between warehouses.
12. When Inventory Turnover Becomes an ERP and Systems Problem
Low turnover is not automatically a software problem. Smaller businesses with straightforward operations can often manage inventory successfully with spreadsheets or focused inventory applications.
The threshold changes when the inventory decision crosses several departments.
12.1 Signs the Current Inventory Stack Is Becoming a Constraint
ERP becomes more relevant when purchasing depends on separate spreadsheets, warehouse inventory does not reconcile with ecommerce availability, accounting repeatedly adjusts inventory values, manufacturing consumes materials outside the same planning system, or managers cannot explain why the inventory number changed.
For companies reaching that level of complexity, XoroERP provides an ERP path that brings inventory-driven operational functions into a more connected environment.
12.2 Why One Operating System Can Improve Inventory Decisions
The advantage does not come from software magically increasing inventory turns.
Instead, connected data reduces the number of assumptions planners must make.
When purchasing, sales orders, inventory, warehousing, manufacturing, forecasting, and accounting draw from one operating environment, management can understand what created the turnover result.
XoroOne is positioned around that broader connected operating model for inventory-driven businesses.
12.3 ERP Alternatives Should Still Be Compared Against Business Requirements
Businesses evaluating ERP should compare workflows rather than brand names alone.
Implementation model, inventory depth, warehouse execution, manufacturing requirements, ecommerce integration, accounting, reporting, EDI, and total operating complexity all matter.
Companies considering larger platforms can use the Xorosoft vs. NetSuite comparison as one reference point while defining which ERP architecture best fits their requirements.
12.4 Inventory Turnover Should Be Part of a Wider Operational Review
Improving one inventory KPI while leaving purchasing, warehousing, accounting, and demand planning disconnected rarely solves the root problem.
Review the complete operating workflow instead.
The broader Xorosoft solutions portfolio shows how inventory, purchasing, warehouse management, manufacturing, reporting, and related workflows can connect when a company moves beyond point solutions.
13. Applying Inventory Turnover Benchmarks to Real Industry Workflows
Published averages provide orientation. Operational workflows determine what the company should actually change.
13.1 Match the Benchmark to the Industry Operating Model
A furniture importer needs different planning rules from an apparel wholesaler. Likewise, a sporting goods company with seasonal products needs different controls from a food distributor with expiring inventory.
That is why businesses should first identify the operating characteristics of their sector before choosing a target. Xorosoft’s industry solution overview provides examples across apparel, distribution, furniture, sporting goods, food, manufacturing, and other inventory-driven environments.
13.2 Use Operating Evidence Instead of Benchmark Numbers Alone
Benchmarks tell management where to investigate. They do not prove which process change will work.
Practical examples from comparable businesses can help teams understand how inventory, warehousing, purchasing, ecommerce, and reporting problems appear in real operations. The Xorosoft case studies can be used as one source of operational examples when teams evaluate process or system changes.
13.3 AI Access Makes Inventory Data More Useful Only When the Data Is Reliable
AI can help managers query operational information, identify exceptions, summarize trends, and surface potential planning issues. However, AI cannot compensate for fragmented or inaccurate source data.
As companies explore agent-based operational workflows, the Xorosoft MCP Server represents one approach to making ERP information available to AI-driven interfaces and workflows.
The principle remains the same: reliable transactions first, intelligent analysis second.
14. Building an Inventory Turnover Dashboard That Operators Will Actually Use
A useful dashboard should tell management where inventory performance changed and why.
Start with company-wide turnover and inventory days. Then show the same measures by category, SKU, warehouse, and channel.
Add inventory aging so managers can identify products that remain unsold beyond expected windows. Pair turnover with stockout rate to catch situations where inventory has become too lean.
Forecast accuracy belongs on the same dashboard because poor demand planning often creates both excess stock and shortages simultaneously.
Supplier lead time is another important measure. A company may appear overstocked compared with an industry benchmark but still need the inventory because suppliers cannot replenish reliably.
Finally, connect inventory value with cash impact. Managers should understand not just how many units remain in stock, but how much working capital they consume.
The most useful dashboard therefore answers five questions:
What is moving? What is not moving? Where is inventory sitting? What could stock out? How much cash is tied up?
When managers can answer those questions quickly, inventory turnover benchmarks by industry become a decision tool instead of a reporting exercise.
15. Inventory Turnover Benchmarks FAQ
15.1 What Is Inventory Turnover?
Inventory turnover measures how frequently a company sells or consumes an amount equal to its average inventory during a period. Businesses typically calculate it by dividing annual COGS by average inventory. The ratio helps evaluate stock efficiency, purchasing discipline, working-capital use, and the relationship between inventory investment and demand.
15.2 What Is a Good Inventory Turnover Ratio?
There is no universally good ratio. A healthy number depends on industry, gross margin, lead time, shelf life, service requirements, supplier reliability, and product lifecycle. For many businesses, mid-single-digit turnover can provide useful context, but the correct target should reflect the company’s operating model.
15.3 What Are Good Inventory Turnover Benchmarks by Industry?
Inventory turnover benchmarks by industry can range from low single digits for slower-moving durable goods to double-digit turnover for grocery and other fast-moving categories. The best benchmark compares businesses with similar products, sourcing models, margins, customer promises, and supply-chain characteristics rather than relying on one universal industry number.
15.4 How Do You Calculate Inventory Turnover?
Divide cost of goods sold by average inventory:
Inventory Turnover = COGS ÷ Average Inventory
For a simple annual calculation, average beginning and ending inventory. Seasonal companies or rapidly growing businesses may get a more representative result by averaging monthly inventory balances instead.
15.5 Should Inventory Turnover Use COGS or Revenue?
COGS generally provides the cleaner calculation because inventory is recorded at cost. Revenue includes gross margin, which can distort comparisons between companies with different pricing structures. If an external benchmark uses sales rather than COGS, make sure the methodology is clearly identified before comparing results.
15.6 What Does an Inventory Turnover Ratio of 2 Mean?
Two turns mean the company sells or consumes an amount equivalent to average inventory roughly twice per year. That corresponds to approximately 183 inventory days. Whether two turns are healthy depends on the sector. It may be reasonable for certain durable products but slow for most grocery or fast-moving consumer categories.
15.7 What Does an Inventory Turnover Ratio of 4 Mean?
Four annual turns equal roughly 91 inventory days. For many durable goods, manufacturing, and specialty retail businesses, that can fall within a reasonable operating range. However, the number should still be compared with historical performance, availability, lead time, product category, and margin.
15.8 What Does Six Inventory Turns Mean?
Six turns represent approximately 61 days of inventory. The business effectively cycles through an amount equal to average inventory about every two months. Six turns can represent strong performance for many distributors, retailers, and manufacturers if stockout rates and service levels remain under control.
15.9 Is Higher Inventory Turnover Always Better?
No. Higher turnover is beneficial only while the company maintains adequate availability. Excessively lean inventory may increase backorders, emergency purchasing, premium freight, and lost sales. Management should therefore evaluate turnover alongside fill rate, stockouts, supplier lead times, and customer service.
15.10 Can Inventory Turnover Be Too High?
Yes. Very high turnover can indicate strong demand and efficient replenishment, but it may also signal understocking. If products repeatedly sell out before replacement inventory arrives, the ratio can improve while customer experience and revenue deteriorate. High turnover must therefore be interpreted alongside availability.
15.11 What Usually Causes Low Inventory Turnover?
Common causes include excessive purchasing, inaccurate forecasts, poor assortment decisions, high supplier MOQs, excess safety stock, long lead times, obsolete items, seasonal carryover, and inventory sitting in the wrong warehouse. The company-wide ratio identifies the issue; SKU- and location-level analysis usually identifies the cause.
15.12 How Can a Company Improve Inventory Turnover?
Improve forecasting, review safety-stock rules, update reorder points, identify slow movers earlier, reduce unnecessary purchase quantities, negotiate supplier terms, rebalance stock between warehouses, and remove obsolete products. Avoid blanket inventory cuts because they can create shortages in otherwise healthy fast-moving products.
15.13 What Is a Good Retail Inventory Turnover Ratio?
Retail varies substantially by category. General and specialty retailers often operate in the mid-single digits, while grocery and other high-frequency categories can move much faster. Comparing one retailer with another only makes sense when assortment, customer expectations, margin, sourcing, and product lifecycle are reasonably similar.
15.14 What Is a Good Ecommerce Inventory Turnover Ratio?
A directional six-to-ten-turn range can provide useful context for many ecommerce businesses, although category matters more than the sales channel alone. An online furniture brand cannot reasonably benchmark itself against a subscription consumables company simply because both sell through ecommerce.
15.15 What Is a Good Wholesale Inventory Turnover Ratio?
Many distributors can use approximately five to ten annual turns as a directional range. However, businesses carrying customer-specific products, long-tail service parts, imported inventory, or high MOQs may operate differently. Service-level requirements should remain part of the benchmark decision.
15.16 What Is a Good Manufacturing Inventory Turnover Ratio?
A broad four-to-eight-turn range provides a useful starting point for many manufacturers. The more important analysis separates raw materials, WIP, and finished goods because each inventory pool may have different causes of slow movement and require different corrective action.
15.17 What Is a Good Apparel Inventory Turnover Ratio?
Many apparel businesses use a directional range around three to six turns, although fast-fashion models can move faster. Seasonality, style lifecycle, size and color variants, markdown strategy, and returns all affect the appropriate target. SKU-level sell-through often provides essential context.
15.18 What Is a Good Furniture Inventory Turnover Ratio?
Furniture tends to move more slowly than grocery, apparel, or fast-moving consumer products. A directional two-to-five-turn range may be more realistic for many operators because items carry higher values, occupy more warehouse space, and frequently involve longer international sourcing cycles.
15.19 How Does Inventory Turnover Affect Cash Flow?
Slow turnover keeps cash invested in products for longer periods. Carrying additional inventory can also increase storage, insurance, handling, markdown, and obsolescence costs. Controlled improvements in turnover can release working capital, provided the company does not create stockouts by reducing inventory too aggressively.
15.20 What Is the Difference Between Inventory Turnover and DIO?
Inventory turnover shows how frequently inventory moves during the year. Days inventory outstanding expresses roughly how many days inventory remains on hand. They are inversely related: when turnover rises, inventory days generally fall.
15.21 What Is the Difference Between Inventory Turnover and Sell-Through?
Inventory turnover evaluates overall inventory efficiency using cost and average inventory. Sell-through usually evaluates what percentage of available or received units of a specific item or collection sold during a defined period. Merchandising teams often use sell-through for more tactical product decisions.
15.22 Should Inventory Turnover Be Calculated by SKU?
Yes, when practical. Company-wide turnover helps evaluate working capital and overall efficiency, while SKU-level analysis shows where excess stock and shortages actually originate. Businesses with very large catalogs can start at category level and then investigate the SKUs responsible for unusual results.
15.23 How Often Should Inventory Turnover Be Reviewed?
Most inventory-driven businesses benefit from monthly monitoring using rolling 12-month calculations. Management should also compare quarterly and annual trends. Seasonal companies should compare equivalent periods year over year so predictable pre-season inventory builds do not create misleading interpretations.
15.24 How Often Should Inventory Turnover Benchmarks by Industry Be Updated?
Review inventory turnover benchmarks by industry at least annually and whenever the operating environment changes materially. Supplier lead times, interest rates, demand patterns, channel strategy, product mix, and warehouse networks can shift what constitutes healthy inventory even when the business remains in the same industry.
15.25 When Should a Business Upgrade From Inventory Software to ERP?
Consider ERP when inventory decisions increasingly depend on accounting, purchasing, manufacturing, ecommerce, EDI, multiple warehouses, forecasting, and several disconnected applications. The trigger is not a specific turnover ratio. It is the point at which fragmented processes prevent teams from understanding and controlling inventory reliably.
16. Turn Inventory Turnover Benchmarks Into Better Inventory Decisions
The most useful inventory turnover benchmarks by industry do not tell a business what number it must achieve. They tell management where to investigate.
Begin with the industry range, but do not stop there. Compare your turnover with your own historical performance. Separate categories and SKUs. Measure inventory by warehouse and channel. Review aging, stockouts, supplier lead times, forecast accuracy, and GMROI alongside the headline ratio.
If turnover remains low, determine whether the real cause sits in purchasing, assortment, supplier constraints, demand planning, warehouse allocation, or obsolete stock. Conversely, if turnover climbs sharply, verify that customer availability has not deteriorated.
As operations become more complex, the quality of the underlying system matters because inventory decisions increasingly cross purchasing, warehouse management, ecommerce, accounting, manufacturing, and forecasting.
The objective is not to produce the highest possible turnover number. It is to build an inventory position that uses working capital efficiently while still supporting sales and customer commitments.
For companies that have outgrown disconnected spreadsheets, inventory apps, or separate operational systems, the practical next step is to evaluate whether the current technology stack can support that level of control.
To discuss your inventory, purchasing, warehouse, accounting, ecommerce, or manufacturing requirements with Xorosoft, contact the Xorosoft team and review the operational gaps before deciding on the right next step.
Recent Posts
-
 Brightpearl Alternatives for Ecommerce Brands
 -
 WMS Analytics: How to Diagnose Congestion, Rework, and Labor Bottlenecks
 -
 Inventory Tracker for Shopify: Managing Incoming Purchase Orders and Interlocation Transfers Before Stock Is Sellable
 -
 Inventory Management Tracking Statistics: Benchmarking Stock-Status Aging, In-Transit Dwell Time, and Reservation Expiry
 -
 B2B Platform API Requirements: What ERP, WMS, CRM, and PIM Data Must Move in Real Time