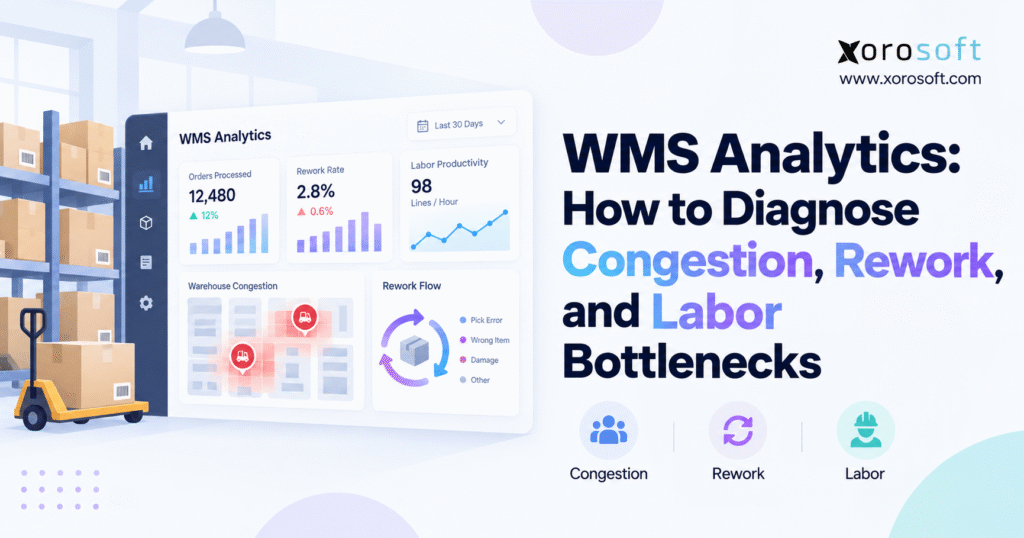
WMS analytics can provide valuable insights for your warehouse management system.
1. Where Warehouse Bottlenecks Actually Begin
Warehouse congestion is rarely as simple as one slow employee, one busy aisle, or one overloaded packing station.
A warehouse can appear highly productive while the overall operation struggles. Pickers may move quickly, receiving teams may unload continuously, and packing stations may stay occupied throughout the shift. Yet orders can still miss carrier cutoffs, inventory can remain in staging for hours, and overtime can rise despite apparently strong productivity.
The reason is simple: warehouse processes depend on each other.
A packing queue may begin with an oversized wave release. A fall in picking output may start with replenishment arriving late. Dock congestion may appear to be a receiving problem even though putaway capacity is preventing inventory from leaving staging.
The visible problem is often the point where the constraint becomes obvious, not where it started.
This is where WMS analytics becomes useful. Instead of asking only how many orders, lines, pallets, or units a team completed, managers can examine how work moved through the warehouse, where it waited, and which upstream conditions changed before performance deteriorated.
Average KPIs can make these problems harder to identify. A healthy daily pick rate may hide one zone that becomes congested every afternoon. Total throughput may look acceptable even when a team relies on overtime to recover from a recurring midday backlog.
High productivity can also coexist with high rework. A team may process transactions rapidly while repeatedly correcting inventory, repacking cartons, relabeling shipments, or revisiting pick locations.
The real objective is therefore not to make every department move faster.
Warehouse leaders need to improve the flow of inventory and orders through the complete operation.
1.1 Why Warehouse Congestion May Not Reveal the Root Cause
Imagine a packing area with 250 orders waiting. The natural reaction is to add packers.
That response may work if packing capacity is genuinely too low. However, the queue could also result from picking releasing too much work at once. Adding permanent packers to solve a temporary release-pattern problem increases labor cost without addressing the underlying cause.
A similar issue occurs when pickers appear slow.
If forward-pick locations are empty, employees may spend time waiting for replenishment, searching for stock, or switching between incomplete tasks. The productivity metric drops at picking even though the operational failure occurred earlier.
Diagnosis should therefore follow the process upstream before management commits resources.
1.2 Local Productivity Can Hide System Problems
Every warehouse department can hit its individual target while the building performs poorly.
Receiving can maximize pallets per hour and overwhelm putaway. Picking can maximize lines per hour and flood packing. Packing can prioritize easy orders while older complex orders continue aging.
Each department appears productive when measured independently.
System-level performance asks a different question: did the complete warehouse move customer demand through the operation efficiently and accurately?
That distinction is central to effective warehouse management.
2. What WMS Analytics Needs to Explain
WMS analytics uses warehouse transaction, inventory, task, labor, location, timing, and exception data to understand operational performance and identify the causes of delays, errors, congestion, and capacity constraints.
Modern warehouses generate this information continuously.
Receiving records arrival times, quantities, discrepancies, and receipt completion. Putaway records movement between staging and storage locations. Replenishment creates tasks between reserve stock and forward-pick locations. Picking captures bins, users, quantities, scans, exceptions, and completion times.
Packing creates another set of operational events. Shipping adds carrier, staging, loading, and dispatch information.
Each transaction provides a small part of the operational story.
The analytical value appears when managers connect those events and reconstruct what happened before a problem occurred.
2.1 How Warehouse Analytics Turns Events Into an Operational Story
Suppose picking throughput falls significantly during the second shift.
A basic report identifies the decline. A stronger analytical process investigates what changed around the same time.
Did replenishment task age increase? Did the order mix shift toward slower-moving SKUs? Was one zone more congested than usual? Did inventory exceptions rise? Did employees spend more time waiting for executable work?
The answer may involve several factors.
WMS analytics should make it possible to move from the KPI to the transactions behind it without forcing supervisors to export multiple spreadsheets every time performance changes.
2.2 WMS Reporting vs Root-Cause Diagnosis
WMS reporting primarily tells management what happened.
Root-cause analysis investigates why it happened.
A report might show that 3,200 lines were picked during a shift. Analysis should explain why one zone performed differently from another, whether travel increased, which tasks waited, how much rework occurred, and whether replenishment influenced the outcome.
Reporting remains essential. Warehouse teams still need operational summaries, backlog counts, shipment status, and productivity measurements.
The problem appears when reporting becomes the final step instead of the starting point for investigation.
A red KPI tells a manager where to look. It should not automatically determine the corrective action.
3. Metrics That Reveal Real Operational Constraints
Warehouse managers do not need hundreds of KPIs.
A smaller group of well-defined measurements usually provides enough information to identify where work is slowing, where capacity is being lost, and whether the operation is improving.
3.1 Warehouse Throughput Analytics Shows Output, Not the Entire Constraint
Throughput measures completed work during a defined time period.
Depending on the process, that could mean units received per hour, pallets put away, lines picked, cartons packed, or orders shipped.
The metric becomes more useful when management compares completed work with incoming workload.
Consider a packing department that receives 600 completed picks every hour but can consistently process only 520 orders.
Even if every employee meets the expected pack rate, approximately 80 additional orders enter the queue every hour.
The problem is not necessarily low productivity. Processing capacity and incoming workload are out of balance.
WMS analytics should make that relationship visible throughout the shift instead of revealing it after the backlog has already created overtime.
3.2 Warehouse Queue Analytics: Why Age Can Matter More Than Size
A large queue is not always dangerous.
Promotions, large inbound deliveries, wholesale order releases, and normal peak periods can create temporary backlogs. The important question is whether the operation can clear them before they affect customer commitments or downstream work.
Queue age provides that context.
Twenty orders waiting ten minutes may create less risk than six priority shipments that have been waiting for several hours.
Managers should monitor current queue size, oldest task age, average or median waiting time, and whether the backlog is growing or shrinking.
The oldest task often deserves more attention than the average.
3.3 Warehouse Dwell-Time Analytics Highlights Stalled Work
Dwell time measures how long inventory, an order, carton, pallet, or task remains in one state before advancing.
Examples include dock-to-putaway time, replenishment waiting time, picked-to-packed time, staging dwell, and return-to-stock time.
Long dwell is especially useful because it exposes inventory that looks complete in one process but has not actually progressed through the operation.
Receiving may show a completed transaction even while the inventory remains in staging.
Picking may show a completed order even though the carton waits two hours before packing begins.
Without dwell-time visibility, departmental completion metrics can create a false impression of flow.
3.4 WMS Analytics Should Account for Rework
Gross transaction volume can also distort performance.
Suppose a warehouse processes 5,000 picking transactions during a shift, but hundreds of those items require recounting, re-picking, repacking, or correction before shipment.
The building generated substantial activity, yet a portion of its labor capacity was used fixing earlier work.
For this reason, WMS analytics should evaluate effective output rather than celebrating transaction volume alone.
4. Using WMS Analytics to Diagnose Congestion
Warehouse congestion develops when people, inventory, equipment, or work accumulate faster than a process or physical area can clear them.
Some congestion is temporary and expected. Other congestion is structural.
The analytical challenge is determining which type the operation is experiencing.
4.1 Warehouse Congestion Analytics Starts Where Work Accumulates
Managers should first identify the physical or process locations where work consistently waits.
Typical accumulation points include receiving docks, inbound staging, putaway queues, replenishment queues, forward-pick aisles, packing stations, outbound staging, and returns-processing areas.
The next step is comparing the current backlog with the normal operating pattern.
A receiving queue every Monday morning may reflect a predictable supplier schedule.
A new backlog that suddenly appears at the same time every afternoon signals something different.
WMS analytics becomes more valuable when current conditions can be compared with historical baselines by day, shift, process, zone, and order profile.
4.2 Compare Incoming Work With Completed Work
One of the most useful warehouse calculations requires no complicated model.
Compare how quickly work enters a process with how quickly that process completes it.
Imagine that picking sends 420 orders to packing every thirty minutes while the pack team completes 360.
A growing queue is inevitable.
The next question creates the operational insight: why are 420 orders arriving in that specific interval?
A large wave may be releasing too much work simultaneously. A promotion may have changed order complexity. A shift change or break pattern could temporarily reduce packing capacity.
Understanding the arrival pattern allows management to fix the cause instead of simply reacting to the queue.
4.3 Separate Physical Congestion From Capacity Constraints
Physical congestion and workload congestion can look similar on a dashboard.
Physical congestion occurs when employees, forklifts, carts, robots, or pallets compete for limited space.
A capacity constraint occurs when a process cannot complete incoming work quickly enough.
The corrective actions differ.
Physical congestion may require better slotting, routing, zoning, traffic rules, or staggered task releases.
A processing constraint might require labor changes, additional workstations, different priorities, or smoother workload release.
Managers should identify which condition exists before increasing headcount.
5. Measuring Rework Without Hiding Its Cost
Rework consumes labor without creating additional customer value.
Warehouse teams often underestimate it because correction becomes part of normal daily activity. An employee recounts a location, another reprints a label, a packer reopens a carton, and a picker returns to correct an item.
Each event may look small.
Across thousands of transactions, repeated touches can consume meaningful warehouse capacity.
5.1 Define Rework Before Trying to Reduce It
Management should first define what qualifies as rework.
Common categories include re-picking, repacking, relabeling, recounting, inventory adjustments, short-pick investigations, repeated scans, shipment corrections, and repeated quality checks.
The objective is not to label every warehouse exception as employee error.
Clear definitions allow teams to understand which corrective activities happen repeatedly and which represent legitimate exceptions.
Consistent reason codes also improve the quality of WMS analytics because management can compare patterns instead of reading vague notes.
5.2 Warehouse Rework Analytics Should Measure Frequency and Labor Time
A basic rework formula is:
Rework Rate = Reworked Transactions ÷ Completed Transactions × 100
The percentage provides useful context, but it should not stand alone.
One relabeling task may take less than a minute. Investigating an inventory discrepancy might consume twenty minutes from a supervisor, picker, or inventory-control employee.
Both count as one rework event, yet the capacity impact is completely different.
Managers should therefore evaluate frequency, labor minutes, and operational consequence.
5.3 Trace Corrections Back to the Original Failure
The point where a problem is corrected is not always where it originated.
Packing may discover an incorrect item that was picked earlier. A picker may encounter missing stock caused by an old receiving or inventory-adjustment error. Shipping might identify a label problem that began with incorrect order data.
A useful transaction trail allows teams to work backward.
Instead of asking, “Where did the error get fixed?” management should ask, “Where did the process first move away from the expected workflow?”
That question produces far better corrective actions.
6. Finding the Real Labor Constraint
Labor is highly visible, so warehouse supervisors naturally examine staffing when throughput declines.
Sometimes that diagnosis is correct.
However, low output can also result from missing inventory, blocked aisles, insufficient equipment, poorly timed replenishment, incomplete tasks, or system delays.
A worker cannot efficiently process work that is not executable.
6.1 Productivity, Utilization, and Efficiency Measure Different Things
Productivity measures output relative to time.
Utilization evaluates how much available time is used for productive activity.
Efficiency generally compares actual performance with a defined expectation or standard.
These measures should not be treated as interchangeable.
An employee can perform quickly whenever work is available and still show low total output because the worker spends substantial time waiting for tasks.
That pattern points toward workflow or capacity planning rather than necessarily toward poor individual performance.
6.2 Warehouse Labor Analytics Gives Idle Time Operational Context
Idle time should be treated as a diagnostic signal.
A picker may be waiting because replenishment has not arrived. A receiver may have no open door. A forklift operator could be waiting for tasks. A packer might lack completed picks.
The correct response depends on what prevented productive activity.
Supervisors should therefore connect labor gaps with task availability, inventory position, equipment status, and process queues.
WMS analytics is particularly useful here because it can help management determine whether paid time disappeared because of employee behavior or because the warehouse system failed to provide executable work.
6.3 Separate Direct Work From Indirect Work
Direct work typically includes receiving, putaway, replenishment, picking, packing, and shipping.
Indirect time may include cleaning, meetings, equipment preparation, administrative activity, searching, or other support tasks.
Both matter.
If indirect time rises unexpectedly, managers can investigate what changed. Perhaps equipment preparation increased. Maybe employees are spending more time searching for misplaced inventory.
The point is not to eliminate every indirect minute. Warehouses need support work.
The goal is to understand how capacity is being consumed.
7. Following Performance From Receiving to Shipping
Warehouse-wide metrics become much more actionable when managers follow inventory through the complete process.
Each stage requires a slightly different diagnostic approach.
7.1 Receiving Should Be Measured by Inventory Availability
Receiving teams are often measured by pallets, cartons, or units processed per hour.
That number matters, but unloading is not the final objective.
Received inventory needs to become accurately available for downstream use.
A better view combines receiving productivity with receipt exceptions, staging dwell, dock-to-stock time, and receipt-to-putaway time.
If receiving processes pallets rapidly while those pallets sit in staging for hours, increasing unloading speed may worsen the bottleneck.
7.2 Putaway Delays Often Reveal Storage Constraints
A growing putaway queue may result from insufficient labor, poor storage availability, long travel, equipment limitations, inaccurate capacity rules, or weak slotting.
Task age is particularly useful.
If newly created putaway tasks complete quickly while older tasks remain open, specific inventory or location conditions may be blocking work.
Managers should investigate those exceptions rather than assuming that the entire putaway team is slow.
7.3 Replenishment Analytics Protects Picking Capacity
Picking depends on forward-pick inventory being available at the right time.
Useful replenishment measures include open tasks, task age, emergency replenishments, empty-location events, and the interval between task creation and completion.
When pick performance falls while forward-location stockouts rise, replenishment becomes the logical place to investigate first.
Adding pickers would do little if those employees cannot access inventory.
7.4 Picking Analytics Needs Order and Inventory Context
Picks per hour remains a useful operational measure.
However, it needs context.
Order type, SKU velocity, travel distance, picking method, zone, short picks, waiting time, and inventory exceptions can all influence output.
Single-line ecommerce orders create a different workload from large wholesale orders. Pallet picking differs from each picking. Zone picking behaves differently from discrete order picking.
A warehouse platform such as XoroWMS can provide a connected environment for warehouse execution, inventory activity, fulfillment, and operational reporting when a business needs more detailed transaction visibility.
7.5 Packing Analytics Should Trace Queues Upstream
Packing congestion often appears to be a packing labor problem because the queue sits directly in front of the team.
Before adding permanent headcount, supervisors should compare pack cycle time with completed picks arriving by interval.
A large wave may send several hundred orders into packing almost simultaneously.
If normal capacity handles average volume but struggles during artificial release peaks, smoothing workflow may be more effective than increasing staffing all day.
7.6 Shipping Performance Should Reflect Customer Commitments
Picking and packing productivity provide little value if completed orders repeatedly miss dispatch.
Shipping analysis should therefore consider staging dwell, carrier cutoff performance, incomplete loads, documentation exceptions, and orders that sit ready but unshipped.
The final measure is not simply whether the warehouse finished processing the order.
It is whether the warehouse supported the promised customer service level.
8. Designing a WMS Analytics Dashboard Around Decisions
Many warehouse dashboards fail because they contain too many numbers and too little direction.
A manager should be able to look at a metric and immediately understand what to investigate next.
8.1 Warehouse Flow Analytics Shows Where Work Slows
Throughput, cycle time, WIP, queue age, and dwell time describe how work moves through the operation.
These measurements should be connected.
A cycle-time increase means more when the manager can immediately see whether the cause is waiting, travel, rework, or slower task execution.
WMS analytics should make that drill-down practical during the shift rather than after the fact.
8.2 Quality Metrics Show the Cost of Errors
Picking accuracy, exceptions, inventory adjustments, short picks, repeated scans, and rework show whether higher speed is producing reliable results.
The best-performing department is not necessarily the one with the highest gross transaction count.
If one area processes faster while creating more corrective work downstream, the system may perform worse overall.
8.3 Labor Metrics Explain Available Capacity
Labor metrics should help answer whether the building has enough capacity for the current workload.
Productivity, utilization, direct activity, indirect time, overtime, and available labor hours all provide useful perspectives.
The key requirement is context.
Labor data should sit alongside workload and task information rather than becoming a separate scorecard disconnected from operational reality.
8.4 Drill-Down Capability Matters More Than More KPIs
One facility-wide average rarely provides enough information for diagnosis.
A useful drill-down path looks like this:
Network → Warehouse → Zone → Process → Shift → Task
That structure allows management to move from an unusual KPI toward the underlying transactions without manually combining several reports.
A smaller dashboard with strong drill-down often provides more value than dozens of high-level metrics.
9. Four Root-Cause Scenarios Warehouse Managers Should Understand
Practical examples show why warehouse managers need more than performance averages.
9.1 Picking Slows Even Though Staffing Is Normal
Assume picking productivity declines during the second shift.
Attendance is normal. Order volume remains similar to the previous day. The employee mix has not changed.
A deeper investigation reveals that replenishment tasks begin aging before picking performance drops. More employees reach empty forward locations and either wait, search, or switch work.
The picking metric shows the symptom.
Replenishment created the constraint.
Adding more pickers in this situation could increase waiting rather than improve throughput.
9.2 Packing Backlog Appears at the Same Time Each Day
The pack team performs normally throughout the morning.
At approximately 2 p.m., the queue starts increasing quickly.
WMS analytics shows that a large wave consistently finishes picking shortly before the backlog begins.
Packing capacity remains relatively stable while incoming work spikes.
Instead of permanently increasing staffing, management could test smoother wave release, different priority logic, changed break timing, or temporary labor reassignment before the predictable peak.
9.3 Receiving Improves While Dock Congestion Gets Worse
Receivers improve their pallets-per-hour result.
At the same time, dock congestion becomes more severe.
The explanation appears downstream. Putaway capacity remains unchanged while receiving feeds inventory into staging faster.
The local receiving KPI improved, but total warehouse flow deteriorated.
This scenario demonstrates why departments should not optimize performance independently.
9.4 Throughput Rises While Rework Also Increases
A warehouse may celebrate higher transaction volume even as recounts, re-picks, repacks, and corrections rise.
Gross throughput looks strong.
Effective throughput tells a different story.
Once labor consumed by repeated work is considered, the operational gain may be much smaller.
That is why speed and quality should always be reviewed together.
10. How Priorities Change by Business Model
Warehouse analytics should reflect the operating model.
Different businesses create different order profiles, inventory risks, handling requirements, and service commitments.
10.1 Ecommerce Warehouse Analytics Requires Intraday Visibility
Ecommerce warehouses often process large numbers of smaller orders against daily carrier deadlines.
Managers need timely visibility into backlog age, order priorities, inventory availability, pick-pack balance, carrier requirements, and fulfillment progress.
A next-day report arrives too late to correct many ecommerce problems.
Shopify merchants also need alignment between storefront orders, inventory, warehouse execution, fulfillment, and financial operations. Xorosoft offers a Shopify ERP integration for merchants that want Shopify activity connected with wider operational workflows.
10.2 Wholesale Distribution Needs Order-Profile Context
Wholesale distributors may handle each, case, pallet, EDI, and customer-specific orders within the same building.
A simple orders-per-hour figure becomes misleading.
One order may contain three lines. Another may contain several hundred.
Labor and throughput analysis should therefore consider lines, units, cases, pallets, order complexity, and fulfillment method.
Companies evaluating different operational requirements can also review Xorosoft’s inventory-driven industry solutions to see how warehouse workflows differ across wholesale, apparel, furniture, food, manufacturing, and other product businesses.
10.3 Apparel Requires SKU-Level Visibility
Apparel operations manage style, size, color, seasonal launches, promotions, and significant return activity.
A high SKU count makes inventory accuracy and slotting especially important.
Managers should be able to isolate problematic product groups, storage locations, and exception patterns rather than treating all items as operationally equivalent.
10.4 Manufacturing Adds Material-Flow Constraints
Manufacturing warehouses must support customer fulfillment and production requirements.
Raw materials, production replenishment, WIP, components, and finished goods all compete for warehouse resources.
A delay in material movement can therefore affect production schedules as well as outbound customer orders.
That makes task prioritization and inventory availability central to analysis.
11. Choosing Between WMS, ERP, BI, and Labor Analytics
Not every operational question should be answered by the same system.
The correct analytical layer depends on what management needs to understand.
11.1 WMS Analytics Provides Execution-Level Detail
The WMS is usually the best source for detailed warehouse activity.
It understands inventory locations, tasks, scans, movements, receiving, replenishment, picking, packing, and shipment events.
When supervisors investigate where work is waiting or which task created an exception, detailed warehouse transaction data is essential.
11.2 Warehouse Labor Analytics Adds Workforce Planning Depth
Larger or more labor-intensive facilities may require engineered standards, workforce planning, workload forecasting, utilization, task benchmarking, and planned-versus-actual analysis.
Those capabilities can extend beyond basic warehouse reporting.
The goal should still be operational.
More labor data only creates value when it helps management match available capacity with actual workload.
11.3 BI Connects Data Across Multiple Systems
Business intelligence tools can help combine information from ERP, WMS, ecommerce, shipping, labor, and other systems.
However, visualization does not fix poor transactional discipline.
A sophisticated dashboard built on missing scans, inconsistent process definitions, or weak reason codes will still produce unreliable conclusions.
Data quality must come first.
11.4 ERP Adds Wider Business Context
Warehouse problems often originate outside the building.
Purchasing affects inbound workload. Sales orders influence fulfillment demand. Manufacturing determines material requirements. Ecommerce promotions can create sudden volume spikes.
A platform such as XoroONE can connect inventory, purchasing, warehouse operations, ecommerce, EDI, accounting, manufacturing, and reporting when a business wants broader operational context.
Organizations with more complex ERP requirements can also evaluate XoroERP when reviewing how warehouse execution should connect with company-wide processes.
The broader principle matters more than a specific technology choice.
Analytics improves when the warehouse can be understood within the business processes surrounding it.
12. When the Bottleneck Is the Technology Architecture
Not every warehouse problem requires new software.
Poor slotting, weak training, inaccurate inventory, bad release logic, and unclear processes cannot be fixed simply by buying another platform.
At the same time, technology architecture can eventually limit what a capable operations team can see and control.
12.1 Manual Reporting Consumes Too Much Management Time
A warning sign appears when supervisors spend hours exporting files, matching formats, removing duplicates, and rebuilding operational reports before every meeting.
The problem is not that spreadsheets exist.
The issue is that management spends more time reconstructing reality than acting on it.
When reporting preparation delays decisions, system architecture becomes part of the operational problem.
12.2 Inventory Disagreements Undermine Analysis
Warehouse diagnosis becomes difficult when different systems disagree about inventory.
The WMS may show one position, ecommerce another, and accounting or ERP a third.
Teams must first reconcile data before they can investigate the original business problem.
Every disagreement increases response time and reduces trust in reporting.
12.3 Multi-Warehouse Analytics Needs Consistent KPI Definitions
Network-level analysis requires consistent KPI definitions.
One warehouse should not calculate cycle time differently from another. Reason codes should not vary dramatically by location. Similar tasks should use consistent classifications.
Without standardization, comparison becomes misleading.
Managers may think one site performs better simply because it measures performance differently.
12.4 Integration Gaps Hide Upstream Causes
As businesses scale, warehouse data frequently needs context from ecommerce, Amazon, EDI, purchasing, accounting, shipping, and manufacturing systems.
A structured integration strategy can reduce manual handoffs and make it easier for teams to trace a warehouse symptom back to an upstream event.
Technology should not be replaced merely to obtain more dashboards.
An upgrade becomes relevant when the current architecture prevents teams from seeing, controlling, or tracing important operational workflows.
13. Building a Practical WMS Analytics Program
Companies do not need every warehouse dashboard on the first day.
A focused program usually produces better adoption because each measurement starts with an operational question.
13.1 Start With Specific Operational Questions
Begin with problems supervisors already need to solve.
Why does packing backlog increase after 3 p.m.? Why do replenishment delays create picker waiting? Which exception type consumes the most corrective labor? Why does one warehouse consistently require more overtime?
Each question defines the necessary data.
A dashboard created around a real management decision is far more likely to influence operations than one built simply because the data exists.
13.2 Validate Data Quality Before Building Dashboards
Missing scans, inconsistent timestamps, vague reason codes, and incomplete task history distort analysis.
Management should verify that system transactions represent what actually happens on the warehouse floor.
If employees regularly bypass a required process, the first question should be why.
Perhaps the workflow is impractical. Maybe training is inconsistent. A device could be unreliable.
Fixing the data-generating process is more important than building a sophisticated dashboard on top of inaccurate information.
13.3 Establish Warehouse Analytics Baselines by Shift and Process
Every metric needs context.
Compare normal performance by weekday, shift, warehouse, zone, process, order type, and season.
A backlog of 300 orders may be unacceptable during an ordinary Tuesday but completely normal during a major promotional event.
Baselines help managers distinguish true abnormalities from expected variation.
13.4 Build Drill-Down Around the Root-Cause Path
A practical analytical path looks like:
KPI change → Process → Zone → Task → Exception
The supervisor should be able to move through those levels quickly.
When drill-down works well, WMS analytics becomes part of daily management instead of a monthly reporting exercise.
13.5 Standardize Exception and Rework Codes
Vague classifications such as “other” reduce analytical value.
More specific reason codes make it easier to separate inventory problems from picking mistakes, packaging issues, equipment failures, data errors, and process exceptions.
The goal is not to create hundreds of codes.
Teams need enough detail to identify repeatable patterns without making data entry unnecessarily difficult.
13.6 Measure Warehouse Performance After Every Corrective Action
Analysis should continue after management makes a change.
If wave timing changes, compare queue age before and after. When slotting changes, measure travel and congestion. If new labor is added, determine whether throughput increased proportionally.
A connected platform such as Xorosoft’s broader business management solutions can support this type of cross-functional visibility when companies want warehouse operations connected with inventory, purchasing, ecommerce, accounting, and other workflows.
The important practice is continuous measurement.
Without it, teams cannot tell whether the corrective action truly improved the constraint.
14. Common Measurement Mistakes That Lead to the Wrong Response
Warehouse data can still lead to poor decisions when management interprets metrics without enough process context.
14.1 Do Not Optimize One Department at the Expense of Flow
A department should not maximize its own throughput if that behavior damages downstream performance.
Picking that floods packing is one example.
Receiving that overwhelms putaway is another.
The warehouse needs balanced flow, not isolated productivity records.
14.2 Do Not Turn Every Labor Gap Into an Employee Problem
Before management judges individual performance, it should confirm that the employee had inventory, tasks, equipment, space, and system availability.
Otherwise, the dashboard risks blaming the person closest to a broken process.
This is why labor metrics must be reviewed with workflow context.
14.3 Warehouse Performance Analytics Should Look Beyond Averages
Averages hide variability.
Two shifts can produce the same average cycle time while operating very differently.
One may perform consistently. The other may process easy orders quickly while allowing complex orders to age for hours.
Queue age, distributions, outliers, and exception patterns reveal details that averages cannot.
14.4 Measure the Original Cause of Rework
Knowing that rework increased matters.
Understanding where the rework originated matters more.
Managers should connect corrective activity to the original warehouse transaction whenever possible.
That connection helps the operation prevent recurrence rather than simply processing corrections more efficiently.
14.5 Better Questions Matter More Than More KPIs
The strongest WMS analytics programs do not necessarily have the most dashboards.
They ask better questions.
What changed before the queue started? Which process feeds this backlog? Is labor really the constraint? Which exception consumes the most capacity? Did the corrective action improve total flow?
Companies evaluating their next operational system can also review relevant Xorosoft customer case studies to understand how inventory-driven businesses approach different warehouse, ERP, and multi-channel operating requirements.
15. Practical Conclusion: Turn WMS Analytics Into Daily Constraint Management
Warehouse performance rarely improves because management adds another dashboard.
Improvement happens when a team can connect an operational signal to the process that created it and then test a measurable corrective action.
Start with flow.
Measure throughput, queue age, dwell time, WIP, exceptions, rework, and labor capacity. When a metric changes, segment the problem by warehouse, zone, process, shift, order type, or task.
Then trace the issue upstream.
A picking slowdown may originate in replenishment. Packing congestion may begin with order-release timing. Dock congestion can reflect limited putaway capacity. Low labor utilization may signal unavailable work rather than an employee-performance problem.
That discipline turns WMS analytics from historical reporting into daily constraint management.
As warehouse complexity grows, businesses should also ask whether their existing technology provides enough transaction history, real-time visibility, multi-warehouse consistency, and system integration to support reliable diagnosis.
The goal is not simply to make the warehouse move faster.
A stronger operation gives managers the ability to explain why performance changed, where capacity disappeared, and which action is most likely to improve flow without creating a new bottleneck somewhere else.
For businesses reviewing warehouse congestion, rework, labor visibility, multi-location operations, or ERP/WMS requirements, the next practical step is to evaluate the process and technology together.
Book a personalized Xorosoft consultation to review your warehouse workflows, reporting gaps, integration requirements, and operational priorities.
Frequently Asked Questions
What is WMS analytics?
WMS analytics uses warehouse task, inventory, labor, timing, and exception data to show where delays, errors, congestion, or capacity constraints are developing.
How does WMS analytics identify warehouse bottlenecks?
It compares queues, dwell time, throughput, workload, and task completion across processes, helping managers locate where work accumulates and whether the root cause sits upstream or downstream.
Which metrics reveal warehouse congestion?
Queue age, work in process, dwell time, throughput, task waiting time, and backlog growth are strong indicators. Comparing incoming work with completed work helps confirm whether congestion is increasing.
How can warehouse labor bottlenecks be diagnosed?
Compare workload with available labor, then review productivity, utilization, idle time, indirect work, and task availability. Low output may reflect blocked workflows rather than insufficient staffing.
How should warehouses measure rework?
Track rework frequency, labor minutes, repeated touches, and reason codes. Also trace corrections back to the original failed transaction so the team can address the source rather than the symptom.
What should a WMS analytics dashboard show?
A useful dashboard should combine throughput, queue age, dwell time, rework, exceptions, labor capacity, and service performance, with drill-downs by warehouse, zone, process, shift, and task.
When should a business upgrade its WMS?
Consider an upgrade when current systems cannot provide reliable inventory, task traceability, multi-warehouse visibility, usable labor data, or timely reporting without heavy spreadsheet work and manual reconciliation.
Recent Posts
-
 ERP Landed Cost Module vs Spreadsheet Calculations for Importers
 -
 How to Build an Open-to-Buy Plan for an Omnichannel Brand
 -
 Cold Storage WMS for Food and Beverage Distribution
 -
 ERP Buying Statistics 2026: Evaluation, Implementation, and Adoption Risks
 -
 How a Distributor Reduced B2B Order Exceptions Without Restricting Sales