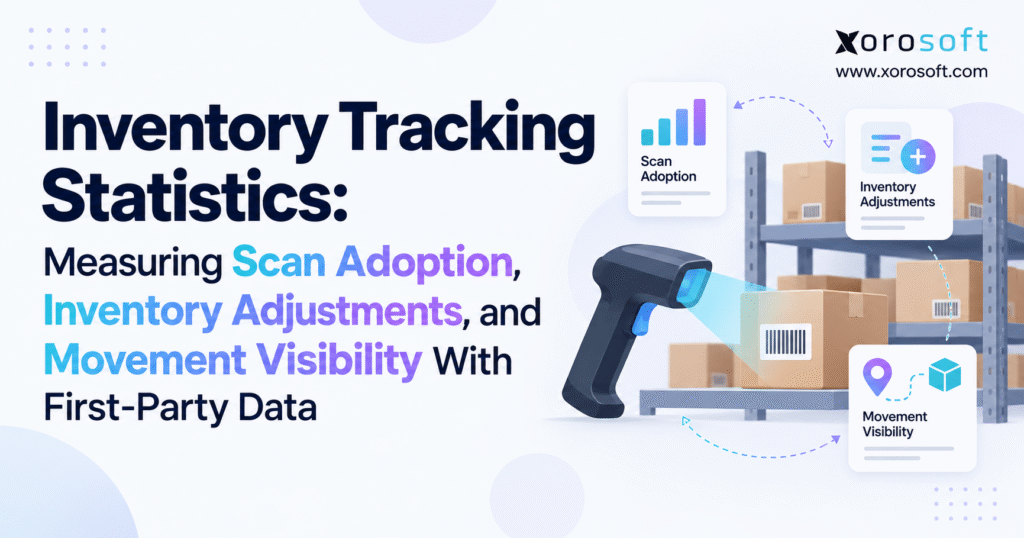
To help you better understand trends in supply management, we’ll explore key inventory tracking statistics in this article.
1. Inventory Tracking Statistics Reveal Where Inventory Control Breaks Down
1.1 What Inventory Tracking Statistics Measure
Inventory tracking statistics show how reliably physical inventory activity becomes usable system data. They connect warehouse execution with the inventory positions that purchasing, sales, ecommerce, finance, and management rely on.
An accurate ending balance does not automatically prove that the underlying process worked correctly. For example, supervisors might manually correct several discrepancies before month-end and still report a clean final quantity. Another operation may show few adjustments simply because employees rarely count inventory or investigate incorrect locations.
Useful inventory tracking metrics therefore examine both results and execution.
Outcome metrics focus on inventory record accuracy, location accuracy, cycle-count variance, inventory adjustment value, and reconciliation differences. These measurements answer whether the final inventory record reflects physical reality.
Process metrics examine scan compliance, manual overrides, transfer completion, missed confirmations, and other activities that create the final record.
Visibility metrics add another layer. They help teams determine whether they can reconstruct what happened to a unit, case, pallet, lot, serial number, or location when an exception appears.
1.2 Inventory Accuracy Does Not Equal Complete Inventory Visibility
Inventory accuracy remains important, but operations teams should not treat it as the only measure of inventory health.
Imagine a business that reports 98% quantity accuracy while employees regularly store products in the wrong bins. The total quantity may match, yet pickers still waste time searching and replenishment teams rely on inaccurate location balances.
A different business may maintain excellent warehouse accuracy while its ecommerce platform receives stock updates several minutes late. Warehouse employees see the correct quantity, but customers can still order inventory that no longer exists.
Some companies also maintain impressive accuracy through constant manual intervention. Experienced employees repeatedly fix discrepancies before anyone notices them.
In that situation, the final number looks strong while the process remains expensive and difficult to scale.
1.3 First-Party Inventory Data Provides More Useful Answers
External benchmarks can show how an operation compares with a research population. First-party data answers a more actionable question: where does our own problem originate?
Reliable transaction records allow managers to compare warehouses, analyze discrepancies by transaction type, identify high-adjustment SKUs, detect recurring unit-of-measure problems, and find processes where employees rely heavily on overrides.
Instead of knowing only that inventory accuracy declined, the business can determine whether receiving, returns, transfers, replenishment, cycle counts, or another workflow drove the decline.
That distinction turns inventory tracking statistics from descriptive reporting into root-cause analysis.
2. First-Party Inventory Tracking Metrics Need a Consistent Measurement Model
2.1 Start With Inventory Events Before Building KPIs
Every useful inventory KPI depends on the events underneath it.
Receiving generates one type of event. Put-away creates another. Replenishment, transfers, picking, production consumption, returns, counting, and adjustments create additional records.
Each event should explain what changed and why.
For a purchase receipt, a useful record may contain the purchase order, SKU, received quantity, unit of measure, warehouse, receiving location, lot or serial data, timestamp, and user.
A transfer should identify the source, destination, quantity, dispatch time, receipt time, and any variance that occurred between locations.
An adjustment needs enough context to explain the correction, including the previous balance, adjusted amount, reason, transaction time, responsible workflow, and approval where required.
Without complete event data, even a sophisticated dashboard can produce weak inventory tracking statistics.
2.2 Define the Numerator and Denominator Before Comparing Results
Two operations teams can report “inventory accuracy” while measuring completely different things.
One company may count an SKU as accurate whenever its total quantity matches. Another may require each SKU-location combination to match. A serialized operation may reject the result if quantities match but serial numbers do not.
Adjustment statistics create the same problem. Warehouse managers may count adjustment transactions, inventory control may measure adjusted units, and finance may measure adjustment value.
Each method can answer a legitimate business question. Problems arise when people compare the results as though they measure the same activity.
Before publishing an inventory tracking KPI, document its numerator, denominator, tolerance, measurement period, exclusions, and unit of analysis.
2.3 Segment Warehouse Inventory Statistics Before Drawing Conclusions
Company-wide averages often hide the process that actually requires attention.
Suppose three warehouses collectively report 96% inventory accuracy. That percentage becomes much more useful when management discovers that two sites perform near 99% while one location creates most of the variance.
The same issue occurs inside individual warehouses. Receiving may perform well while transfers create repeated discrepancies. Picking may achieve strong scan compliance while returns still depend heavily on manual entries.
Teams should therefore segment warehouse inventory statistics by warehouse, workflow, SKU, product family, location, shift, user, supplier, customer channel, and adjustment reason whenever enough data exists.
The goal is not to create more dashboards. Management needs enough detail to identify where a corrective action will produce the greatest improvement.
3. Scan Adoption and Scan Compliance Metrics Measure Warehouse Process Discipline
3.1 Scan Adoption Shows Whether Controlled Workflows Exist
Purchasing scanners does not mean a warehouse has successfully adopted scanning.
Scan adoption should measure how broadly the operation has implemented controlled scanning across workflows where it makes sense.
A practical formula is:
Scan Adoption Rate = Scan-Enabled Workflows ÷ Eligible Workflows × 100
Assume a warehouse considers receiving, put-away, replenishment, internal transfers, picking, packing, shipping, and cycle counting eligible for controlled scanning. If six of those eight workflows support required scanning, workflow-level adoption equals 75%.
This metric measures implementation coverage. It does not reveal whether employees actually perform the required scans.
For that reason, an operation can achieve high scan adoption while still maintaining weak transaction control.
3.2 Scan Compliance Rate Measures Actual Execution
Scan compliance answers a more important operational question: when the workflow required a scan, did the employee perform it?
A useful formula is:
Scan Compliance Rate = Transactions Completed With the Required Scan ÷ Transactions Requiring a Scan × 100
This metric belongs among the most valuable inventory tracking statistics because it measures warehouse behavior directly.
A business may discover excellent receiving compliance but weak compliance during internal transfers. Another location may require location scans during picking but allow manual confirmation during replenishment.
Overall scan percentages can easily hide these process differences. Teams should review compliance by workflow first, then segment results by warehouse, location, user, device, shift, or product group when they need deeper analysis.
3.3 Scan Adoption and Scan Compliance Answer Different Questions
| Measurement | Scan Adoption | Scan Compliance |
|---|---|---|
| Main question | Does the workflow support scanning? | Did the required scan occur? |
| Measures | Deployment coverage | Execution discipline |
| Typical denominator | Eligible workflows | Required transactions |
| Common issue | Process lacks scan control | User bypasses scan |
| Best use | Rollout management | Operational control |
Combining these measurements can produce misleading conclusions.
An organization may describe itself as “100% barcode-enabled” because every workstation has scanning hardware. That claim says nothing about how many inventory movements employees actually confirm through the controlled process.
3.4 Manual Override Rate Explains Scan Exceptions
Manual confirmation does not always indicate poor execution.
Damaged barcodes, incorrect supplier labels, connectivity issues, or urgent exceptions may require legitimate overrides. Operations teams need visibility into those exceptions rather than assuming every manual transaction represents an error.
A useful formula is:
Manual Override Rate = Manually Confirmed Transactions ÷ Transactions Requiring Controlled Confirmation × 100
Managers should review override trends over time and segment them by workflow, device, user, product, location, and reason.
When overrides suddenly rise in one warehouse zone, the team should first investigate label quality, scanner performance, network coverage, slotting, packaging, or workflow design.
3.5 Scan Statistics Should Measure Transactions, Not Hardware Ownership
Organizations often confuse technology deployment with process control.
Scanner counts, employee training records, device logins, and labels printed may help project teams manage a rollout, but those figures do not show whether inventory movements follow the intended workflow.
Operational measurement should focus on transactions.
How many receipts passed through controlled scanning? What percentage of picks included the required location and item confirmation? Did both sides of a transfer complete the expected workflow? How many cycle counts used the approved mobile process?
Those questions reveal whether scanning actually supports inventory accuracy.
4. Inventory Tracking Statistics for Adjustments and Accuracy Need Operational Context
4.1 Inventory Adjustment Rate Shows How Often Records Need Correction
Nearly every inventory-driven operation needs occasional adjustments.
Products become damaged. Counts uncover differences. Suppliers send unexpected quantities. Returns arrive in different conditions. Production consumption varies from expectations.
Management should focus less on whether adjustments exist and more on their frequency, magnitude, reason, and direction.
Companies can calculate adjustment activity in several ways.
A transaction-based formula is:
Adjustment Transactions ÷ Total Inventory Transactions × 100
A quantity-based measure uses:
Absolute Units Adjusted ÷ Total Units Handled × 100
Finance may prefer:
Absolute Adjustment Value ÷ Inventory Value Handled × 100
Each method provides a different perspective. Consistency matters more than selecting one formula for every organization.
4.2 Positive and Negative Adjustments Need Separate Analysis
Net adjustment value can help financial reporting, but it can conceal operational instability.
Suppose a warehouse adds 1,000 units through positive adjustments and removes 1,000 units through negative adjustments during the same month. The net quantity change equals zero.
Operationally, however, employees corrected 2,000 units.
For useful inventory tracking statistics, managers should examine positive adjustments, negative adjustments, total absolute quantity, financial value, transaction count, and reason codes separately.
That approach reveals whether teams repeatedly find unexpected inventory, lose recorded inventory, or experience errors in both directions.
4.3 Adjustment Reason Codes Turn Corrections Into Root-Cause Data
Reason codes give inventory adjustments their diagnostic value.
A receiving discrepancy points toward inbound execution or supplier performance. A wrong-location adjustment may signal a put-away problem. A unit-of-measure error often points toward item setup rather than warehouse behavior.
A practical reason-code structure may include receiving discrepancy, damage, shrinkage, wrong location, pick error, cycle-count correction, return correction, unit-of-measure error, master-data error, and unknown cause.
Keep the list specific enough to support analysis but simple enough that employees choose consistently.
The system should also allow “unknown” when the team genuinely cannot determine the cause. Forcing a false explanation only damages the dataset.
If unknown adjustments increase over time, that trend becomes a KPI of its own.
4.4 Inventory Accuracy Statistics Require a Clear Formula
One practical formula for inventory record accuracy is:
Accurate SKU-Location Records ÷ SKU-Location Records Counted × 100
CAPS Research benchmark data discussed by the Institute for Supply Management reported an average inventory accuracy rate of 91% for its measured population, with the lowest-performing companies at 67%. The ISM discussion also described approximately 90% as good and 95% as world-class performance.
Those figures provide context rather than a universal target.
A high-volume ecommerce warehouse, serialized industrial distributor, food operation, and small wholesaler may use different accuracy definitions and face very different consequences when records fail.
For most businesses, a consistently calculated internal trend provides more operational value than chasing an external percentage without matching methodologies.
4.5 Location Accuracy Deserves Its Own Inventory Tracking KPI
Correct total quantity does not guarantee correct location data.
Imagine that both the system and physical count show 400 units in a warehouse. At first glance, quantity accuracy looks perfect.
Now assume employees stored 70 units in bins different from those recorded in the WMS.
Pickers still receive incorrect instructions. Replenishment becomes harder. Cycle counters spend additional time finding inventory.
Location accuracy should therefore stand beside quantity accuracy rather than hiding underneath it.
This metric becomes especially important in multi-bin, multi-zone, or multi-warehouse environments where location determines whether workers can find and fulfill the inventory efficiently.
4.6 Cycle Count Metrics Should Help Prevent Future Variances
Cycle counting should produce more insight than a final adjustment.
Teams can analyze the percentage of count lines that match, absolute variance quantity, variance value, recount rate, pending reviews, and time required to resolve discrepancies.
Repeated differences often point to an upstream process.
Variances concentrated in replenishment locations may indicate weak movement confirmation. Problems involving case packs may reveal unit-of-measure issues. Frequent corrections after returns may expose gaps in reverse logistics.
The best cycle-count program does more than correct the inventory record. It helps operations identify why the record became incorrect in the first place.
5. Inventory Movement Visibility Metrics Show Whether Teams Can Trace Stock
5.1 Inventory Visibility Requires More Than an On-Hand Balance
Many systems display current on-hand inventory. That alone does not provide complete movement visibility.
Operations teams also need to understand how inventory arrived at its current position.
A useful movement record should identify what moved, how much moved, where it came from, where it went, when the movement occurred, which transaction caused it, and who or what recorded the activity.
Depending on the industry, additional data may include lot, batch, expiry date, serial number, license plate, unit of measure, inventory status, purchase order, sales order, production order, or transfer reference.
This transaction history transforms inventory balances into traceable operational data.
5.2 Movement Traceability Extends Inventory Tracking Statistics Beyond Accuracy
Companies can create an internal movement traceability rate with a simple formula:
Movement Traceability Rate = Fully Traceable Inventory Movements ÷ Total Inventory Movements × 100
The organization must define “fully traceable” before calculating the result.
A straightforward consumer-goods operation may require SKU, quantity, source, destination, timestamp, and transaction reference. Food companies may add lot and expiry information. Serialized equipment distributors may require an individual serial number for every movement.
The value comes from defining the minimum information that every controlled transaction should contain.
5.3 Movement Record Completeness Exposes Weak Data Capture
A system may record every movement while still collecting incomplete information.
For example, a transaction might show that ten units moved without recording the source bin. A warehouse transfer may indicate that stock left one location without capturing when the destination received it. An adjustment may change the quantity without explaining why.
Teams can measure record completeness by checking required fields such as SKU, quantity, source, destination, transaction type, timestamp, user, device, reference, lot, serial number, and inventory status.
This metric works especially well when an organization gradually replaces manual processes with more controlled digital workflows.
5.4 Inventory Update Latency Can Create Visibility Problems Without Warehouse Errors
Not every inventory visibility issue begins with incorrect physical execution.
Consider an ecommerce business that ships an order at 2:00 p.m. The warehouse records the event correctly, but Shopify does not receive the new available quantity until 2:20 p.m.
During those twenty minutes, the physical stock and WMS may both remain accurate while the sales channel shows stale availability.
Two measurements help diagnose this issue.
Event-to-system latency measures the time between the physical activity and the ERP or WMS update.
System-to-channel latency measures how long an internal inventory change takes to reach Shopify, Amazon, B2B ecommerce, or another connected platform.
Fast-moving businesses should monitor both because synchronization delays can produce overselling even when warehouse accuracy remains strong.
5.5 Multi-Warehouse Transfer Visibility Prevents Inventory From Disappearing Between Sites
Transfers often create blind spots.
A basic system may subtract inventory from Warehouse A and eventually add it to Warehouse B. That model provides little visibility between those points.
A more controlled workflow distinguishes stages such as created, allocated, picked, shipped, in transit, received, variance identified, and closed.
Operations teams can then see whether stock still sits at the source, travels between sites, waits for destination receipt, or remains tied to an unresolved discrepancy.
For multi-location businesses, transfer-state visibility deserves a prominent place among inventory tracking statistics because it prevents in-transit inventory from becoming operationally invisible.
6. Reading Inventory Tracking Statistics Together Produces Better Decisions
6.1 High Accuracy With Low Scan Compliance Signals Future Risk
A warehouse can maintain strong accuracy even as process discipline declines.
Experienced employees may compensate for weak controls. Supervisors may make frequent corrections. Low transaction volume may temporarily hide process failures.
If scan compliance falls while inventory accuracy remains stable, management should investigate before the outcome deteriorates.
Leading indicators such as scan compliance, override rate, and movement completeness often expose risk earlier than month-end accuracy.
6.2 High Adjustments With Strong Scan Compliance Point to Other Causes
The reverse pattern also occurs.
Employees may scan almost every required transaction while the warehouse continues posting frequent adjustments.
More scanning will not necessarily solve that problem.
Teams should investigate receiving quantities, units of measure, master data, supplier labeling, return handling, production consumption, or other upstream processes.
One KPI rarely provides the complete answer. Inventory tracking statistics work best when teams interpret the relationships among them.
6.3 Low Adjustment Activity Does Not Prove High Accuracy
A warehouse that rarely makes adjustments may still maintain inaccurate records.
Employees might perform too few cycle counts. Supervisors may leave differences unresolved. Workers may know the inventory record is wrong and simply work around it.
Healthy inventory control does not mean eliminating every adjustment.
Strong operations identify discrepancies quickly, explain the cause, correct the record, and reduce recurrence.
6.4 Internal Trends Usually Matter More Than One Universal Benchmark
External benchmarks help establish context, but internal trends often drive better decisions.
A warehouse that improves accuracy from 92% to 97% while simultaneously reducing overrides and unexplained adjustments demonstrates meaningful progress.
By contrast, another operation may remain at 98% accuracy while adjustment activity doubles.
Warehouse inventory statistics should show whether the process becomes more stable over time, not simply whether the business can claim a particular percentage.
7. Inventory Tracking Metrics Change With the Business Model
7.1 Apparel Operations Need Variant-Level Inventory Accuracy
Apparel businesses often manage styles across multiple colors and sizes.
A style-level quantity can appear correct while the variant-level inventory remains wrong. Twenty shirts provide little useful availability if the system records the wrong distribution across small, medium, and large sizes.
Apparel teams should pay close attention to variant-level location accuracy, return adjustments, transfer discrepancies, and pick-scan compliance.
Companies operating across ecommerce, wholesale, retail, and several warehouses also need inventory data that supports each channel without creating separate versions of the truth.
The same principle applies across many inventory-driven industries: the metric should reflect how the business actually stores, sells, and fulfills inventory.
7.2 Wholesale Distribution Needs Unit-of-Measure Visibility
Wholesale distributors often transact in cases, inner packs, eaches, pallets, or customer-specific units.
That complexity can create what looks like an inventory discrepancy even when the underlying problem involves conversion logic.
If a receiver records a twelve-unit case incorrectly, the error can affect availability, purchasing, picking, billing, and inventory valuation at once.
Wholesale operations should therefore analyze adjustment reason codes for unit-of-measure problems and monitor conversion-related corrections separately from physical shrinkage or location errors.
7.3 Food and Beverage Tracking Requires Lot and Expiry Context
Food and beverage businesses cannot rely on quantity alone.
Their operations may also need accurate lot numbers, expiry dates, statuses, storage locations, and movement histories.
A warehouse may physically hold the correct quantity while the system identifies the wrong lot as available for shipment.
Recall requirements create another reason to strengthen movement visibility. Teams need to identify which receipt created the inventory, where the lot moved, which customers received it, and how much stock remains.
7.4 Manufacturing Adds Material Consumption and WIP Visibility
Manufacturing creates additional inventory states.
Raw materials move from receiving into storage, then into production staging and work in process before finished goods return to available inventory.
Each stage can create a discrepancy.
Useful manufacturing metrics include material issue accuracy, production consumption variance, WIP visibility, finished-goods receipt accuracy, and adjustment value by work order or production area.
Companies that manage production in spreadsheets while the warehouse uses another inventory system often struggle to trace the original cause of a variance.
7.5 Ecommerce Inventory Tracking Must Include Channel Synchronization
Ecommerce brands need accurate warehouse data and accurate available-to-sell quantities.
Strong warehouse execution cannot prevent overselling if the ecommerce platform receives stock updates too slowly.
Teams should monitor warehouse accuracy, return update latency, channel synchronization latency, multi-location transfer visibility, and manual stock corrections together.
Shopify merchants evaluating a connected operating model can review the Xorosoft ERP Shopify App when considering how ecommerce orders, inventory, and fulfillment connect with ERP workflows.
For online sellers, customers experience inventory accuracy through the quantity that the storefront allows them to purchase.
8. ERP and WMS Architecture Determines the Quality of Inventory Tracking Data
8.1 Warehouse Execution Should Capture Data Where Movement Happens
The strongest inventory records usually originate where employees perform the physical work.
Receiving staff confirm incoming products. Put-away operators identify destination locations. Pickers validate products and bins. Transfer workflows record inventory leaving and entering facilities. Cycle counters enter physical quantities directly into the warehouse process.
A warehouse management system can provide the execution layer for those controlled activities.
The key objective is to minimize the time between the physical event and the corresponding system event.
When employees move stock first and update the system later, physical reality and system reality separate. Higher transaction volumes make that gap increasingly difficult to manage.
8.2 ERP Connects Inventory Movement With Purchasing, Finance, and Planning
Warehouse transactions affect processes far beyond the warehouse.
Purchase receipts affect open purchasing commitments and inventory value. Shipments influence sales orders, cost of goods sold, and channel availability. Production receipts create finished goods while component consumption reduces raw materials. Adjustments can affect financial reporting.
A broader ERP architecture connects those activities.
For growing inventory-driven businesses, XoroONE connects inventory, purchasing, warehouse operations, accounting, forecasting, and ecommerce within a broader operating system.
Organizations with more complex requirements can also evaluate XoroERP alongside other enterprise platforms based on warehouse depth, manufacturing needs, financial controls, integrations, implementation requirements, and scale.
The architecture matters more than the product name. A company should not need to recreate the same physical inventory event manually across multiple systems.
8.3 Integrations Should Preserve One Inventory Record
Many businesses accumulate specialized software as they grow.
They might use Shopify for ecommerce, one accounting platform for finance, a warehouse application for scanning, an EDI service for wholesale orders, and spreadsheets for purchasing or planning.
Each application may solve a valid problem. Trouble begins when several systems attempt to control the same inventory balance.
A sound ERP integration strategy should establish which platform owns inventory, how transactions move between applications, how teams monitor failed updates, and how the architecture prevents duplicate changes.
Without clear ownership, apparent warehouse errors may actually originate from integration delays, duplicate transactions, or conflicting availability logic.
8.4 Inventory Tracking Statistics Should Shape Software Requirements
Businesses often evaluate ERP and WMS software through long feature lists.
A stronger approach starts with the operational measurements that the current system cannot produce reliably.
Managers should first determine whether they can distinguish scanned activity from manual confirmation. Adjustment reporting should reveal reason codes and recurring causes without requiring spreadsheet cleanup. Transfer history needs to follow inventory from release through receipt, while warehouse views should show stock by location, lot, serial number, and status where those dimensions matter.
Finance also needs a clear path from an inventory correction back to the warehouse event that caused it.
These requirements connect software selection with measurable operational outcomes rather than generic feature counts.
Companies researching alternatives to larger enterprise systems can review a focused Xorosoft vs NetSuite comparison while still evaluating each platform against their own process requirements.
8.5 Operational Complexity Usually Creates the Upgrade Trigger
Revenue alone does not determine when a business needs a stronger inventory platform.
Operational complexity often provides a better signal.
A second warehouse, wholesale channel, EDI program, manufacturing workflow, growing ecommerce operation, or expanding SKU catalog can expose limitations that did not matter earlier.
One of the clearest warning signs appears when teams cannot calculate inventory tracking statistics without manually combining spreadsheets and exports from several applications.
If managers cannot quickly determine scan compliance, adjustment reasons, transfer status, movement history, or location accuracy, the reporting limitation may reveal a deeper systems problem.
Companies evaluating that stage can use Xorosoft case studies to review how other inventory-driven businesses approached operational and system changes, while still validating every requirement against their own processes.
9. Turn Inventory Tracking Statistics Into a Practical Inventory Control System
9.1 Start With a Small Group of Reliable KPIs
More metrics do not automatically create better inventory control.
Operations teams often gain more value from six clearly defined KPIs than from thirty dashboards that different departments interpret differently.
A strong starting set includes inventory record accuracy, location accuracy, scan compliance, adjustment rate, cycle-count variance, and movement traceability.
After teams trust those measurements, they can add manual override rate, channel synchronization latency, transfer variance, reason-code distribution, and discrepancy resolution time.
Every KPI should have a clear formula, data source, review cadence, owner, and expected response when performance falls outside the team’s acceptable range.
9.2 Use Inventory Tracking Statistics to Find Root Causes
Inventory measurement becomes less useful when teams treat every KPI as a tool for assigning blame.
Warehouse errors often come from process design.
A picker may bypass a scan because packaging covers the barcode. Receivers may adjust quantities because supplier units do not match item-master settings. Cycle counters may repeatedly find errors because employees perform uncontrolled internal moves.
Good measurement exposes those conditions.
Managers should ask what process produced the discrepancy before assuming one employee caused it. That approach improves both operations and data quality because teams have less incentive to hide legitimate exceptions.
9.3 Make Every Meaningful Inventory Movement Explainable
The long-term goal is not a perfect dashboard. The goal is an operation where teams can explain meaningful inventory changes quickly.
A quantity change should carry a clear reason. Stock movement should preserve both the source and destination. Cycle-count differences need enough transaction history for managers to investigate likely causes, while ecommerce balances should remain aligned with warehouse records as availability changes.
That is the practical value of inventory tracking statistics: they turn inventory accuracy from a periodic counting exercise into an ongoing operating discipline.
Businesses that still depend heavily on spreadsheets, repeated manual reconciliation, disconnected warehouse applications, or frequent ecommerce stock corrections should first identify where visibility breaks down. From there, leaders can determine whether process changes will solve the issue or whether the underlying technology architecture needs improvement.
For inventory-driven companies evaluating that next step, Xorosoft can be assessed against the same operational criteria discussed throughout this article: scan control, movement visibility, adjustment analysis, multi-warehouse execution, ecommerce synchronization, purchasing, accounting, and reporting.
The useful question is not which ERP offers the longest feature list. The better question is whether the platform gives operations enough reliable first-party data to explain inventory movement and act on discrepancies before they reach customers or financial reporting.
Teams that want to review those workflows against their current inventory process can contact Xorosoft to discuss their warehouses, sales channels, integrations, and inventory-control requirements.
Frequently Asked Questions About Inventory Tracking Statistics
What are inventory tracking statistics?
Inventory tracking statistics measure how accurately and consistently inventory movements, scans, counts, adjustments, and locations are recorded across warehouse and ERP workflows.
How do you calculate inventory accuracy?
A common formula divides accurate SKU-location records by total SKU-location records counted, then multiplies by 100. Use one consistent method across locations and reporting periods.
What is scan compliance in a warehouse?
Scan compliance measures how often employees complete required barcode scans during receiving, put-away, transfers, picking, packing, shipping, or cycle counting.
How do you calculate inventory adjustment rate?
Divide inventory adjustment transactions by total inventory transactions, then multiply by 100. Companies can also measure adjusted units or adjustment value, depending on the operational goal.
What is inventory movement visibility?
Inventory movement visibility means being able to trace what moved, how much, from where, to where, when, why, and under which transaction.
Why do inventory discrepancies keep happening?
Common causes include receiving errors, missed scans, incorrect locations, unit-of-measure mistakes, unrecorded transfers, returns issues, damaged stock, master-data errors, and delayed system updates.
When should a business upgrade to an ERP or WMS?
Consider upgrading when manual reconciliation, frequent adjustments, multi-warehouse complexity, weak movement history, disconnected ecommerce channels, or unreliable location data make inventory difficult to control.
Search
Categories
- & INTEGRATIONS 1
- ACCOUNTING & FINANCIALS 62
- Business 133
- COMPETITOR & BUYER INTENT 132
- E-COMMERCE & CHANNEL INTEGRATIONS 72
- ECommerce 3
- Ecommerce + Wholesale Complexity 7
- ERP 1,300
- FINANCE & ACCOUNTING 9
- INVENTORY & OPERATIONS 78
- Inventory Management Software 146
- OPERATIONS & INVENTORY 96
- PROCUREMENT & SUPPLY CHAIN 9
- PURCHASING & SUPPLY CHAIN 62
- SHOPIFY ERP 92
- SHOPIFY STOCKY OPPORTUNITY 2
- Software 1
- WAREHOUSE & FULFILLMENT WMS 92
- WHOLESALE & DISTRIBUTION 106
- WMS 75
- WMS & FULFILLMENT 15
- WMS & WAREHOUSE 75
Recent Posts
-
 Inventory Checking Statistics: Which Count Variance, Recount Rate, and Bin-Level Error Metrics Should Warehouses Track?
 -
 Best ERP Software for Apparel Manufacturers
 -
 How to Reconcile 3PL Billing: From Warehouse Events to Customer Invoice
 -
 NetSuite Alternatives for Shopify Businesses
 -
 Shopify B2B Inventory Control: Preventing the Same Stock From Being Promised Twice