If you’re seeking the latest inventory carrying cost statistics, this article will help you understand the numbers and what they mean for your business.
1. Inventory Carrying Cost Statistics Show Why One Benchmark Is Not Enough
1.1 What Current Inventory Carrying Cost Statistics Tell Operators
The first lesson from current inventory carrying cost statistics is simple: no single carrying-cost percentage applies to every organization.
APQC’s cross-industry benchmark reports a median of roughly 10.0% of average inventory value. Its methodology includes opportunity or capital cost, storage, insurance, taxes, handling and administration, shrinkage, and obsolescence.
Retail references can run considerably higher because retailers often manage broader assortments, seasonal demand, returns, promotions, markdowns, and fast-changing customer preferences. Shopify’s current guidance uses a 20% to 30% range for many retail businesses.
A furniture distributor can face substantial warehouse expense even when its unit count looks modest because individual products consume large amounts of space. Apparel companies may store more units in less physical space yet face greater markdown exposure. Food distributors often move stock quickly but must manage spoilage, expiration dates, and temperature-controlled storage.
These differences explain why inventory carrying cost benchmarks work best as comparison points rather than rigid targets.
Operators need to understand both the percentage and the business model behind it.
1.2 Why the 20% to 30% Carrying-Cost Rule Persists
The 20% to 30% range remains popular because it gives businesses a practical starting point when they have not yet measured their actual costs.
Assume a company holds $2 million in average inventory. Using a 25% planning rate suggests approximately $500,000 in annual carrying cost.
That estimate can help management model the financial impact of excess inventory, evaluate a proposed bulk purchase, or estimate the benefit of reducing average stock.
It should not become the company’s reported carrying-cost figure unless the underlying expenses support it.
A planning assumption answers, “What might this inventory cost us?”
A measured carrying-cost rate answers, “What does this inventory actually cost us?”
Keeping those two concepts separate prevents misleading comparisons and better supports financial decisions.
1.3 Benchmark the Cost Structure, Not Just the Percentage
Two companies can both report a 20% carrying-cost rate while having entirely different operational problems.
One business may suffer from expensive warehouse space but carry little obsolete stock. Another may have low storage costs but routinely mark down old inventory. A third may finance purchases at a high interest rate while maintaining strong inventory turnover.
Management should therefore compare the components behind the percentage.
A useful review asks how much of the total comes from capital, storage, service, and inventory risk. That analysis usually reveals more actionable opportunities than the headline rate alone.
2. What Inventory Carrying Cost Includes
2.1 Inventory Carrying Cost Definition
Inventory carrying cost represents the total annual economic cost of owning inventory before the business sells, consumes, transfers, writes down, or removes it from stock.
Companies usually express the result as a percentage of average inventory value.
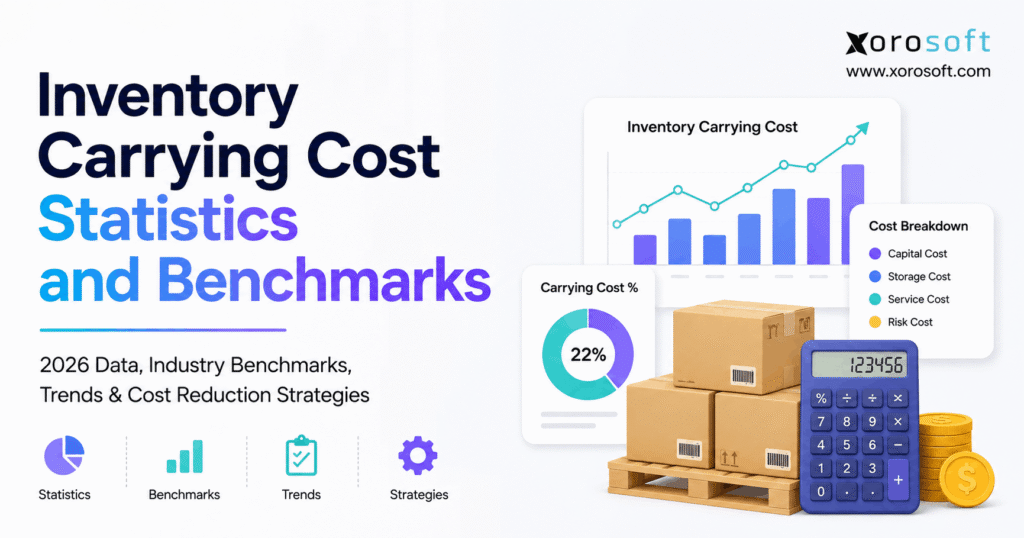
Most frameworks divide the calculation into four major areas: capital cost, storage cost, inventory service cost, and inventory risk cost. This structure makes inventory carrying cost statistics easier to interpret because two companies can hold the same dollar value of inventory and still face very different annual costs.
2.2 Capital Cost Ties Working Capital to Inventory
Capital cost reflects the economic burden of money invested in stock.
For businesses that finance inventory with debt, the calculation can include interest and other funding costs. Cash-funded companies should still consider opportunity cost.
A dollar sitting in slow-moving stock cannot simultaneously fund another product launch, equipment purchase, marketing campaign, acquisition, hiring plan, automation project, or debt repayment.
The impact becomes more important as inventory balances grow.
A company holding $500,000 of stock can absorb a planning mistake more easily than one holding $15 million. Even a small improvement in carrying-cost percentage can represent a meaningful amount of cash when the inventory base is large.
2.3 Storage Costs Extend Beyond Warehouse Rent
Warehouse rent represents the most visible storage expense, but inventory also consumes racking, utilities, security, equipment, physical space, and handling capacity.
Businesses should not automatically classify every warehouse expense as carrying cost. Receiving, picking, packing, and shipping support throughput and fulfillment as well as inventory ownership.
The important point is consistency.
Finance and operations should agree on an allocation method and apply it the same way over time. Changing the methodology every quarter makes trend analysis less meaningful.
A repeatable framework allows management to see whether the underlying economics genuinely improved.
2.4 Inventory Service and Risk Costs Can Be Easy to Miss
Inventory service costs can include insurance, applicable taxes, administration, and technology that supports inventory control.
Risk costs often create the greatest surprises. Shrinkage, theft, damage, spoilage, markdowns, and obsolescence can quietly erode inventory value.
An industrial fastener may remain commercially useful for years, while a fashion item can lose much of its value in one season. Food products introduce expiration risk, and consumer electronics can lose demand quickly when manufacturers launch newer models.
For this reason, businesses should avoid comparing inventory holding cost benchmarks without considering product lifecycle and risk.
3. How to Calculate Inventory Carrying Cost Percentage Correctly
3.1 Inventory Carrying Cost Formula
The standard formula is:
Inventory Carrying Cost % = Total Annual Inventory Carrying Costs ÷ Average Inventory Value × 100
Suppose a business holds $1 million in average inventory and calculates $180,000 of annual carrying costs.
The calculation is:
$180,000 ÷ $1,000,000 × 100 = 18%
That company has a measured inventory carrying cost percentage of 18%.
The formula is straightforward. The quality of the result depends on whether the business accurately calculates average inventory and includes the appropriate costs in the numerator.
3.2 Use Average Inventory Instead of One Convenient Snapshot
Seasonal businesses can generate misleading results if they rely only on year-end inventory.
A retailer may build inventory ahead of a holiday period and finish December with much less stock. An importer may receive several large containers during the year. Manufacturing companies may accumulate raw materials before major production runs.
Monthly average inventory generally produces a more representative result.
Businesses with fast-moving or highly seasonal stock may prefer weekly averages.
The objective is not theoretical perfection. Management needs a consistent baseline that finance and operations can repeat and compare over time.
3.3 A Practical Inventory Carrying Cost Example
Consider a distributor that maintains $2.5 million in average inventory.
At a 15% carrying-cost rate, the annual economic cost equals approximately $375,000. Increasing the rate to 20% raises that amount to $500,000, while a 25% rate pushes it to $625,000. Once the carrying-cost rate reaches 30%, annual cost climbs to $750,000.
This example shows why inventory carrying cost statistics become much more meaningful when management converts percentages into dollars.
A difference of five percentage points may look small on a dashboard. Across millions of dollars of inventory, it can represent substantial working capital and operating expense.
| Average Inventory | 10% Rate | 20% Rate | 25% Rate | 30% Rate |
|---|---|---|---|---|
| $100,000 | $10,000 | $20,000 | $25,000 | $30,000 |
| $500,000 | $50,000 | $100,000 | $125,000 | $150,000 |
| $1,000,000 | $100,000 | $200,000 | $250,000 | $300,000 |
| $5,000,000 | $500,000 | $1,000,000 | $1,250,000 | $1,500,000 |
These figures represent calculation scenarios rather than universal benchmarks.
3.4 Calculate the Cost at a Useful Level of Detail
A company-wide percentage provides a useful starting point, but it may hide the real source of the problem.
A business with a 20% overall carrying cost could have one category running efficiently and another absorbing significant markdowns. One warehouse may turn inventory quickly while another stores excess stock. A profitable product family may subsidize slow-moving items that consume disproportionate space.
Once management establishes the overall rate, the next step should be segmentation.
Breaking the analysis down by category, warehouse, brand, supplier, SKU class, or inventory age can turn a high-level finance metric into an operational decision-making tool.
4. Inventory Carrying Cost Statistics and Benchmarks Vary by Industry
4.1 Retail and Ecommerce Inventory Carrying Cost Benchmarks
Retail inventory combines several types of risk.
Businesses may manage promotions, product launches, returns, seasonality, channel-specific demand, markdowns, and thousands of SKU combinations.
Shopify’s current guidance references a 20% to 30% carrying-cost range for many retailers. That range provides useful context, but a retailer should still calculate its own rate.
A merchant selling evergreen household consumables will operate differently from an apparel brand launching new collections every quarter. The first may prioritize availability and replenishment speed, while the second faces greater markdown and trend risk.
For Shopify merchants that need broader operational integration, Xorosoft is also available through the Shopify App Store, where businesses can evaluate how ecommerce transactions connect with wider ERP workflows.
4.2 Wholesale Distribution Inventory Carrying Cost Benchmarks
Wholesalers often maintain inventory to protect service levels across large product catalogs and customer bases.
Supplier minimums, imported goods, full-container purchases, long lead times, customer commitments, and broad SKU assortments can gradually increase stock.
U.S. Census Bureau data reported approximately $919.6 billion in merchant-wholesaler inventories in February 2026, with an inventories-to-sales ratio of approximately 1.22.
That ratio does not measure carrying cost directly, but it shows how much capital wholesale businesses collectively commit to stock.
Organizations comparing requirements across wholesale, apparel, retail, manufacturing, furniture, food, and consumer products can review ERP solutions for inventory-driven industries to understand how inventory requirements change across operating models.
4.3 Manufacturing Inventory Carrying Cost Benchmarks
Manufacturers need to examine more than finished goods.
Raw materials, work in process, packaging, components, and completed products can all consume working capital simultaneously.
A manufacturer might successfully reduce finished-goods inventory while still overbuying components because supplier minimums or production plans remain unchanged.
Looking only at one company-wide number can hide that problem.
Manufacturers should segment carrying costs by inventory stage and then connect each category to its operational driver. Raw-material excess may point to purchasing or MRP issues, while finished-goods excess may reflect forecasting or production planning.
4.4 Why Industry Benchmarks Need Context
Industry labels alone do not determine inventory economics.
Two apparel brands can have different carrying costs if one sells timeless basics and the other depends on seasonal collections. Two furniture distributors can differ because one operates from inexpensive warehouse space while another serves expensive urban markets.
Company size also matters. Financing terms, supplier leverage, network design, and product mix all influence the final rate.
For that reason, inventory carrying cost statistics should help frame an investigation rather than end it.
5. Why Inventory Carrying Costs Rise Above Benchmark Levels
5.1 Overstock Usually Starts With a Planning Decision
Excess inventory rarely appears randomly.
Teams often create it through optimistic forecasts, bulk-purchase incentives, supplier minimums, outdated reorder points, weak visibility, or fear of stockouts.
A buyer may save 5% on unit price by purchasing twice the quantity needed.
That decision looks attractive when the buyer measures only purchase price.
If the extra inventory remains on hand for nine months, financing, storage, insurance, handling, and markdown exposure can eliminate much of the initial saving.
Strong purchasing teams therefore evaluate total inventory economics instead of unit price alone.
5.2 Slow-Moving Inventory Keeps Consuming Cash
Slow-moving products continue creating economic cost even when sales activity disappears.
The warehouse still stores them. Employees continue counting them. Capital remains tied up, and insurance remains applicable. Eventually the business may discount, liquidate, write off, or dispose of the stock.
Inventory aging reports should therefore support financial decisions rather than only warehouse housekeeping.
A practical aging structure might separate inventory into 0–30 days, 31–60 days, 61–90 days, 91–180 days, 181–365 days, and more than one year.
The exact bands should match the product lifecycle.
A 90-day-old grocery item and a 90-day-old industrial component clearly do not carry the same risk.
5.3 Safety Stock Can Become Excess Inventory
Safety stock protects customer service when supply or demand changes unexpectedly.
The problem begins when teams treat safety-stock settings as permanent.
If a supplier reduces lead time from eight weeks to four, the original buffer may no longer make sense. When demand becomes more stable, the company may also need less protection. Greater volatility can require the opposite response.
Teams should review safety stock against current lead times, forecast error, supplier reliability, and customer-service targets.
Cutting buffers simply to improve inventory carrying cost statistics can create stockouts and lost revenue. That is not a real improvement.
5.4 Long Lead Times Increase the Inventory Requirement
Long supplier lead times force businesses to make decisions farther in advance.
The further a purchasing decision extends into the future, the more uncertainty enters the forecast.
Imported products often amplify this issue. A company may need to consider production time, consolidation, ocean freight, customs, receiving, and warehouse availability before products become sellable.
Long lead times can justify additional inventory, but they also increase the cost of forecast errors.
Reducing lead-time variability can sometimes create more value than negotiating another small unit-cost discount.
6. Inventory Carrying Cost Statistics Need Supporting KPIs
6.1 Inventory Turnover Adds Velocity to the Picture
Inventory turnover measures how frequently a company sells or consumes stock during a period.
Faster turnover often reduces average inventory and limits exposure to storage and obsolescence.
Turnover alone can still mislead managers.
A company can raise turns by carrying too little inventory, only to create backorders and missed sales.
Management should therefore examine carrying cost and inventory turnover together.
6.2 Days Inventory Outstanding Shows How Long Cash Stays Locked Up
Days inventory outstanding estimates how long inventory remains on hand.
If DIO rises while sales stay relatively stable, purchasing may be running ahead of customer demand.
That trend deserves attention before higher stock levels become permanent.
DIO also gives executives a more intuitive way to interpret inventory economics. Saying that inventory costs 18% annually and saying that an average unit remains in stock for 110 days describe different parts of the same operating reality.
6.3 Service Levels Prevent Cost Cutting From Going Too Far
The lowest carrying-cost percentage does not automatically represent the strongest inventory strategy.
A company can slash stock, improve working capital, and still create an operational problem if customers cannot buy what they need.
A balanced inventory scorecard should connect carrying cost with turnover, DIO, fill rate, stockout rate, forecast accuracy, aging inventory, inventory accuracy, and GMROI.
| KPI | What It Helps Explain |
| Carrying-cost percentage | Economic cost of inventory |
| Inventory turnover | Inventory velocity |
| Days inventory outstanding | Time inventory remains on hand |
| Fill rate | Ability to satisfy demand |
| Stockout rate | Availability risk |
| Forecast accuracy | Planning quality |
| Inventory accuracy | Reliability of quantities |
| Aging inventory | Slow-moving exposure |
| GMROI | Margin generated by inventory investment |
No single metric should drive inventory decisions by itself.
6.4 Forecast Accuracy Explains How Inventory Gets There
Forecast accuracy belongs in the same conversation because purchasing decisions begin with an expectation about future demand.
If a team consistently overestimates sales, excess inventory becomes predictable rather than accidental.
Managers should also watch forecast bias, not just forecast accuracy.
A forecast can appear reasonably accurate overall while repeatedly leaning high. Persistent positive bias can quietly increase stock every purchasing cycle.
7. High Inventory Carrying Costs Affect More Than the Warehouse
7.1 Inventory Converts Flexible Cash Into a Less Flexible Asset
Cash gives a company options.
Once money becomes physical inventory, the business normally needs to sell, transfer, return, discount, liquidate, or write off that stock before recovering the capital.
This creates a common growth problem.
Revenue rises, purchasing expands, and inventory grows. The company may remain profitable on paper while cash becomes increasingly tight because working capital moves into warehouses faster than sales release it.
That is why inventory carrying cost statistics should matter to founders and CFOs as much as warehouse or purchasing teams.
7.2 Carrying Cost Changes Product Profitability
Gross margin does not show the complete economics of a SKU.
Consider two products.
Product A generates a 50% gross margin but turns once a year, consumes significant warehouse space, and frequently requires markdowns.
Product B earns a 35% margin but turns eight times per year and occupies very little space.
Traditional gross-margin reporting may make Product A look superior. Inventory economics can tell a different story.
Carrying-cost analysis gives finance, merchandising, and purchasing teams another lens for assortment decisions.
7.3 Warehouse Space Has an Opportunity Cost
Slow-moving inventory does more than occupy physical space. It prevents the company from using that space for faster-moving or more profitable products.
A furniture business may have enough units to satisfy demand but still require another facility because obsolete or low-velocity stock consumes valuable floor space.
A distributor might rent overflow storage during a seasonal peak even though part of its primary warehouse contains products that have not moved for a year.
Reducing unnecessary inventory can therefore delay expansion and improve warehouse productivity at the same time.
7.4 Carrying Cost Can Affect Supplier Strategy
Inventory economics also influence supplier negotiations.
The cheapest supplier may not create the lowest total cost if that supplier requires large minimums, long commitments, or inflexible lead times.
A more expensive supplier that offers smaller order quantities or faster replenishment can sometimes reduce working-capital requirements enough to offset the purchase-price difference.
Carrying-cost analysis gives procurement teams a better basis for evaluating these trade-offs.
8. How to Reduce Inventory Carrying Costs Without Increasing Stockouts
8.1 Improve Forecasting Before Cutting Purchase Orders
Inventory reduction should begin with stronger demand planning rather than arbitrary purchasing restrictions.
Forecasting needs to account for historical demand, seasonality, promotions, customer commitments, supplier lead times, channel differences, and product lifecycle changes.
Teams should also measure bias.
If planners consistently overestimate demand, inventory can grow even when average forecast accuracy looks acceptable.
Better forecasting will never remove uncertainty, but it can reduce repeated and predictable mistakes.
8.2 Recalculate Reorder Points and Safety Stock
Static reorder points quickly become outdated.
Demand changes. Supplier performance changes. Minimum order quantities evolve. New warehouses open. Service-level expectations shift.
Teams should revisit reorder logic regularly and segment policies by SKU characteristics.
A high-volume, predictable product should not automatically use the same safety-stock model as an erratic long-tail SKU.
This is one of the clearest ways to reduce inventory without simply transferring the problem into customer-service failures.
8.3 Combine ABC Analysis With Inventory Aging
ABC analysis tells teams where financial value sits.
Inventory aging tells them how long products have remained on hand.
Using both together creates a stronger prioritization method.
A high-value A-item aging well beyond its expected lifecycle deserves immediate attention. A low-value C-item may justify a simpler rule because detailed manual analysis could cost more than the potential savings.
The combination helps teams focus management effort where it can release the most cash.
8.4 Make Purchasing Decisions on Total Cost
Buyers often receive incentives to negotiate lower unit prices.
That matters, but the lowest purchase price does not always produce the lowest total cost.
One supplier may offer a discount if the buyer doubles the order. Another may charge slightly more while offering shorter lead times and smaller minimums.
The second supplier can sometimes produce better overall economics.
Purchasing teams should evaluate landed cost, lead time, quantity, carrying cost, supplier reliability, and product risk together.
8.5 Balance Inventory Across Multiple Warehouses
Multi-location businesses can create excess inventory even when total demand planning looks accurate.
One warehouse may hold 500 excess units while another creates a new purchase order for the same SKU.
A capable warehouse management system helps operators see stock across locations and coordinate transfers. Xorosoft can support this multi-warehouse model by connecting warehouse activity with purchasing and inventory data.
Transfer-versus-purchase logic often creates a practical opportunity to reduce unnecessary stock without lowering service levels.
8.6 Improve Inventory Accuracy Before Automating Replenishment
Automation depends on reliable data.
If the system reports 200 units but the warehouse physically contains 140, even excellent replenishment logic begins with the wrong input.
Cycle counting, barcode workflows, disciplined receiving, accurate returns processing, transfer controls, and adjustment procedures improve the foundation.
Once teams trust inventory records, they can automate repetitive replenishment decisions with much greater confidence.
8.7 Create a Clear Exit Strategy for Aging Stock
Companies often identify slow-moving inventory but fail to define what happens next.
Aging policies should assign actions to specific thresholds.
The business may stop replenishment, transfer stock, return goods to suppliers where agreements allow it, bundle products, discount them, use them in promotions, or liquidate truly obsolete inventory.
The longer teams wait, the fewer options they usually have.
A clear exit strategy converts aging analysis from a reporting exercise into a working-capital process.
9. When Carrying Cost Problems Point to a Systems Problem
9.1 Disconnected Systems Create Hidden Inventory Costs
Many businesses grow successfully using QuickBooks, spreadsheets, ecommerce applications, warehouse tools, and separate purchasing files.
These systems do not suddenly stop functioning at a particular revenue threshold.
Instead, coordination work grows.
Purchasing teams export inventory information. Finance reconciles stock values. Warehouse employees maintain separate records. Ecommerce teams compare Shopify or Amazon quantities. Management rebuilds reports from multiple sources.
Eventually, manual coordination begins affecting decision speed and data reliability.
Those hidden costs rarely appear in an inventory carrying cost statistics benchmark, yet they influence how effectively the company manages inventory.
9.2 ERP Inventory Management Becomes Relevant as Complexity Grows
ERP becomes more relevant when inventory decisions depend on accounting, purchasing, forecasting, ecommerce, warehouse, manufacturing, and sales information at the same time.
For businesses reaching that stage, ERP inventory management can create a shared operational model across departments. Xorosoft is one platform designed for inventory-driven companies that need those processes connected.
ERP does not automatically make sense simply because a company holds inventory.
A business with a small SKU count, one sales channel, simple purchasing, and one straightforward warehouse may work effectively with lighter software.
The case for ERP becomes stronger when disconnected systems begin creating measurable stock errors, purchasing delays, duplicate work, reconciliation challenges, and visibility gaps.
9.3 Compare ERP Platforms Against the Actual Operating Model
Growing inventory businesses may evaluate Xorosoft alongside NetSuite, Acumatica, Microsoft Business Central, Sage, Cin7, Brightpearl, Fishbowl, and other platforms.
The right comparison should focus on requirements rather than brand recognition alone.
Operators need to evaluate inventory depth, accounting, purchasing, warehouse workflows, ecommerce, manufacturing, EDI, reporting, integrations, implementation requirements, internal resources, and total cost.
Businesses specifically comparing those two ERP options can use a Xorosoft vs NetSuite comparison as one input into a broader evaluation.
10. Inventory Carrying Cost Benchmarks Across Different Operating Models
10.1 Apparel and Fashion Inventory
Apparel companies manage style, color, size, season, collection, and channel complexity.
A product can remain physically sellable while losing full-price demand quickly.
Markdown exposure therefore deserves a meaningful role in carrying-cost analysis.
Companies should also analyze inventory below the style level where possible. Strong demand for one size or color does not solve excess stock in another variant.
Fashion operators need to connect assortment planning, allocation, sell-through, replenishment, and aging information.
10.2 Furniture and Home-Goods Inventory
Furniture creates a different economic challenge.
Individual units can consume significant cubic space, require specialized handling, and turn more slowly than smaller consumer goods.
A warehouse full of slow-moving furniture can create capacity problems before unit counts appear extreme.
Furniture businesses should therefore consider inventory velocity, margin, and space consumption together.
Cubic utilization can sometimes reveal more about storage pressure than simple unit counts.
10.3 Food and Beverage Inventory
Food introduces shelf-life risk.
A durable industrial component may sit for months without losing physical value. Food products can have much shorter commercial windows.
That changes the role of forecasting, purchasing, lot tracking, rotation, and inventory aging.
Operators need to know not just how much inventory exists, but when it expires and how quickly current demand can consume it.
Spoilage can turn carrying cost into a direct inventory loss, making purchasing discipline especially important.
10.4 Wholesale and Consumer Products
Wholesale and consumer-product businesses often balance broad product availability against working-capital efficiency.
Customer commitments, EDI, ecommerce demand, supplier minimums, multi-warehouse allocation, and purchasing cycles can all influence how much inventory the company needs.
For businesses that require one operating layer across these functions, a cloud ERP for inventory-driven businesses can help centralize information. Xorosoft combines inventory, accounting, purchasing, warehouse management, manufacturing, forecasting, reporting, and ecommerce operations so teams can connect carrying-cost problems to the decisions that create them.
11. Inventory Carrying Cost Statistics: Frequently Asked Questions
11.1 What is inventory carrying cost?
Inventory carrying cost represents the annual economic cost of owning inventory before the company sells or consumes it. The calculation normally includes capital, storage, service, and risk costs such as shrinkage, damage, and obsolescence. Businesses usually express the result as a percentage of average inventory value.
11.2 What is another name for inventory carrying cost?
Inventory professionals commonly use inventory holding cost as a synonym for carrying cost. Both terms describe the economic burden of maintaining stock over time. Storage cost remains narrower because storage represents only one part of total carrying cost.
11.3 What do current inventory carrying cost statistics show?
Current inventory carrying cost statistics show a wide range. APQC reports a 10.0% cross-industry median, while retail and practitioner guidance commonly references figures from approximately 15% to 30%. Businesses should compare the methodology behind each figure before using it as a target.
11.4 What is a good inventory carrying cost percentage?
No universal percentage qualifies as good. The appropriate level depends on product category, financing, warehouse requirements, inventory velocity, service targets, shrinkage, obsolescence, and which expenses the company includes in the calculation.
11.5 Is 20% a normal inventory carrying cost?
A 20% rate falls within several commonly cited practitioner and retail ranges. However, the benchmark alone cannot determine whether a company manages inventory effectively. Management should examine the individual cost components and compare service performance with relevant peers.
11.6 Is 30% inventory carrying cost too high?
A 30% rate deserves investigation, especially when slow-moving stock, expensive financing, excessive storage, or obsolescence drives the result. Some categories naturally face greater risk, so businesses should compare themselves with companies that operate similar product and fulfillment models.
11.7 What is the inventory carrying cost formula?
Use this formula: Total Annual Inventory Carrying Costs ÷ Average Inventory Value × 100. If annual carrying expenses equal $250,000 and average inventory equals $1 million, the company’s carrying-cost percentage equals 25%.
11.8 What costs belong in inventory carrying cost?
Businesses commonly include capital cost, warehouse space, insurance, applicable taxes, handling and administration, shrinkage, damage, spoilage, markdowns, and obsolescence. Management should apply the same methodology from one reporting period to the next.
11.9 Does warehouse rent count as carrying cost?
Yes. Companies can include the portion of warehouse rent associated with storing inventory. They should allocate shared facility costs consistently because warehouses also support receiving, picking, packing, offices, and shipping operations.
11.10 Does labor count as inventory carrying cost?
Companies may include inventory-related handling and administrative labor when their methodology requires it. Labor used primarily for order fulfillment may fit better under fulfillment or operating expense rather than inventory holding cost.
11.11 Does insurance count as inventory carrying cost?
Yes. Companies typically classify inventory insurance as an inventory service cost. Expensive, fragile, theft-sensitive, or regulated products can create different insurance economics from lower-risk inventory.
11.12 Is inventory obsolescence part of carrying cost?
Yes. Obsolescence represents an inventory risk cost. Fashion, electronics, seasonal merchandise, food, packaging changes, and short-lifecycle products often face greater exposure because stock can lose economic value before the company sells it.
11.13 How does excess inventory increase carrying cost?
Excess inventory ties up additional working capital and may consume more warehouse capacity, handling, insurance, and administrative effort. It also increases exposure to markdowns, damage, shrinkage, spoilage, and obsolescence.
11.14 How does inventory turnover affect carrying cost?
Faster inventory turnover usually reduces average stock levels and limits the amount of time products remain exposed to storage and obsolescence. However, pushing turns too high can create shortages, so companies should monitor service levels at the same time.
11.15 How does safety stock affect inventory carrying cost?
Safety stock raises average inventory and therefore increases carrying cost. The goal is not to eliminate the buffer. Companies should size safety stock according to demand variability, supplier lead times, supplier reliability, and target service levels.
11.16 How does forecasting reduce carrying costs?
Better forecasting helps purchasing teams align orders with expected demand. It can reduce chronic overbuying, improve replenishment timing, and allow planners to adjust reorder points and safety stock earlier when demand changes.
11.17 What is dead stock?
Dead stock describes products that a business no longer expects to sell through normal demand. It continues consuming space and capital until the company returns, liquidates, repurposes, writes off, or disposes of it.
11.18 Can carrying cost be calculated by SKU?
Yes. Businesses can estimate SKU-level carrying costs using inventory value, age, turnover, space consumption, markdown history, spoilage, and other product-specific drivers. Category-level analysis often provides a practical starting point before moving to SKU-level detail.
11.19 How often should businesses measure carrying costs?
Annual measurement provides a baseline, while quarterly reviews usually give inventory-intensive companies better visibility. Seasonal retailers, high-growth businesses, importers, and organizations with volatile warehouse or financing costs may benefit from more frequent monitoring.
11.20 How do multiple warehouses affect carrying cost?
Multiple warehouses can increase carrying costs when each location maintains separate safety stock or when inventory becomes unbalanced across sites. Central visibility helps teams transfer existing units before purchasing additional stock.
11.21 Which KPIs should companies track with carrying cost?
Companies should review inventory turnover, days inventory outstanding, aging stock, forecast accuracy, fill rate, stockout rate, inventory accuracy, and GMROI alongside carrying cost. These metrics help management balance working-capital efficiency with customer service.
11.22 Can high inventory carrying costs reduce profitability?
Yes. Carrying costs consume capital, warehouse capacity, insurance, administration, and risk expense. A product can show an attractive gross margin while producing weaker economics after the company accounts for slow turnover and long holding periods.
11.23 How can a company reduce carrying cost without creating stockouts?
Improve forecasting, update reorder points, segment safety stock, analyze aging inventory, strengthen supplier planning, increase inventory accuracy, and rebalance stock between warehouses. Teams should monitor fill rate and stockouts throughout the process.
11.24 When should a business move from spreadsheets to ERP?
ERP becomes relevant when disconnected spreadsheets and applications create duplicate work, conflicting inventory numbers, purchasing delays, difficult reconciliation, or limited visibility across warehouses, channels, accounting, and manufacturing.
11.25 Why do inventory carrying cost benchmarks disagree?
Different benchmarks cover different businesses and may include different expense categories. Industry mix, product risk, capital assumptions, warehouse economics, inventory velocity, and accounting methodology all affect the final number. That is why inventory carrying cost statistics require context before teams use them for decisions.
12. Conclusion: Turn Inventory Carrying Cost Statistics Into Better Inventory Decisions
The most useful lesson from inventory carrying cost statistics is not that every company should target 10%, 20%, or 30%.
Inventory begins consuming economic resources as soon as the company commits cash to it.
Operators should calculate their own carrying-cost rate, determine how much comes from capital, storage, service, and risk, and compare that result with appropriate external benchmarks. The next step is to segment the issue by SKU, category, warehouse, supplier, inventory age, and channel.
That analysis usually reveals where action matters most.
Some businesses discover that large supplier orders create the majority of excess stock. Others find outdated safety-stock policies, weak forecasts, slow-moving SKUs, poor warehouse balancing, or unreliable inventory records.
The objective should never be to minimize inventory at any cost.
A stronger goal is to carry enough stock to meet customer commitments while keeping working capital, warehouse expense, and inventory risk at economically sensible levels.
When high carrying costs repeatedly trace back to disconnected purchasing, accounting, forecasting, ecommerce, warehouse, or manufacturing systems, technology may become part of the solution. Xorosoft serves inventory-driven businesses that need those workflows connected rather than managed across separate applications and spreadsheets.
Businesses that want to evaluate whether integrated ERP could materially improve inventory control can contact Xorosoft for a personalized discussion.
Search
Categories
- Competitor & buyers 232
- E-COMMERCE & CHANNEL INTEGRATIONS 72
- ERP 569
- Industries 213
- Integrations 123
- Inventory management software 355
- PROCUREMENT & SUPPLY CHAIN 9
- Resources 232
- SHOPIFY ERP 123
- Solutions 566
- Wholesale & distribution 213
- WMS & Warehouse 211
Recent Posts
-
 Warehouse Receiving Benchmarks 2026: Accuracy, Dwell Time, and Throughput
 -
 B2B Platform vs ERP Ordering Portal: Which System Should Handle Buyer Self-Service?
 -
 Shopify B2B Pricing Governance: Price Lists, Overrides, Discounts, and ERP Ownership
 -
 ERP for Canadian Food Manufacturers Managing Lots, Expiry Dates, and Recalls
 -
 Shopify Return Restocking: Why Returned Inventory Goes Live Before Warehouse Approval