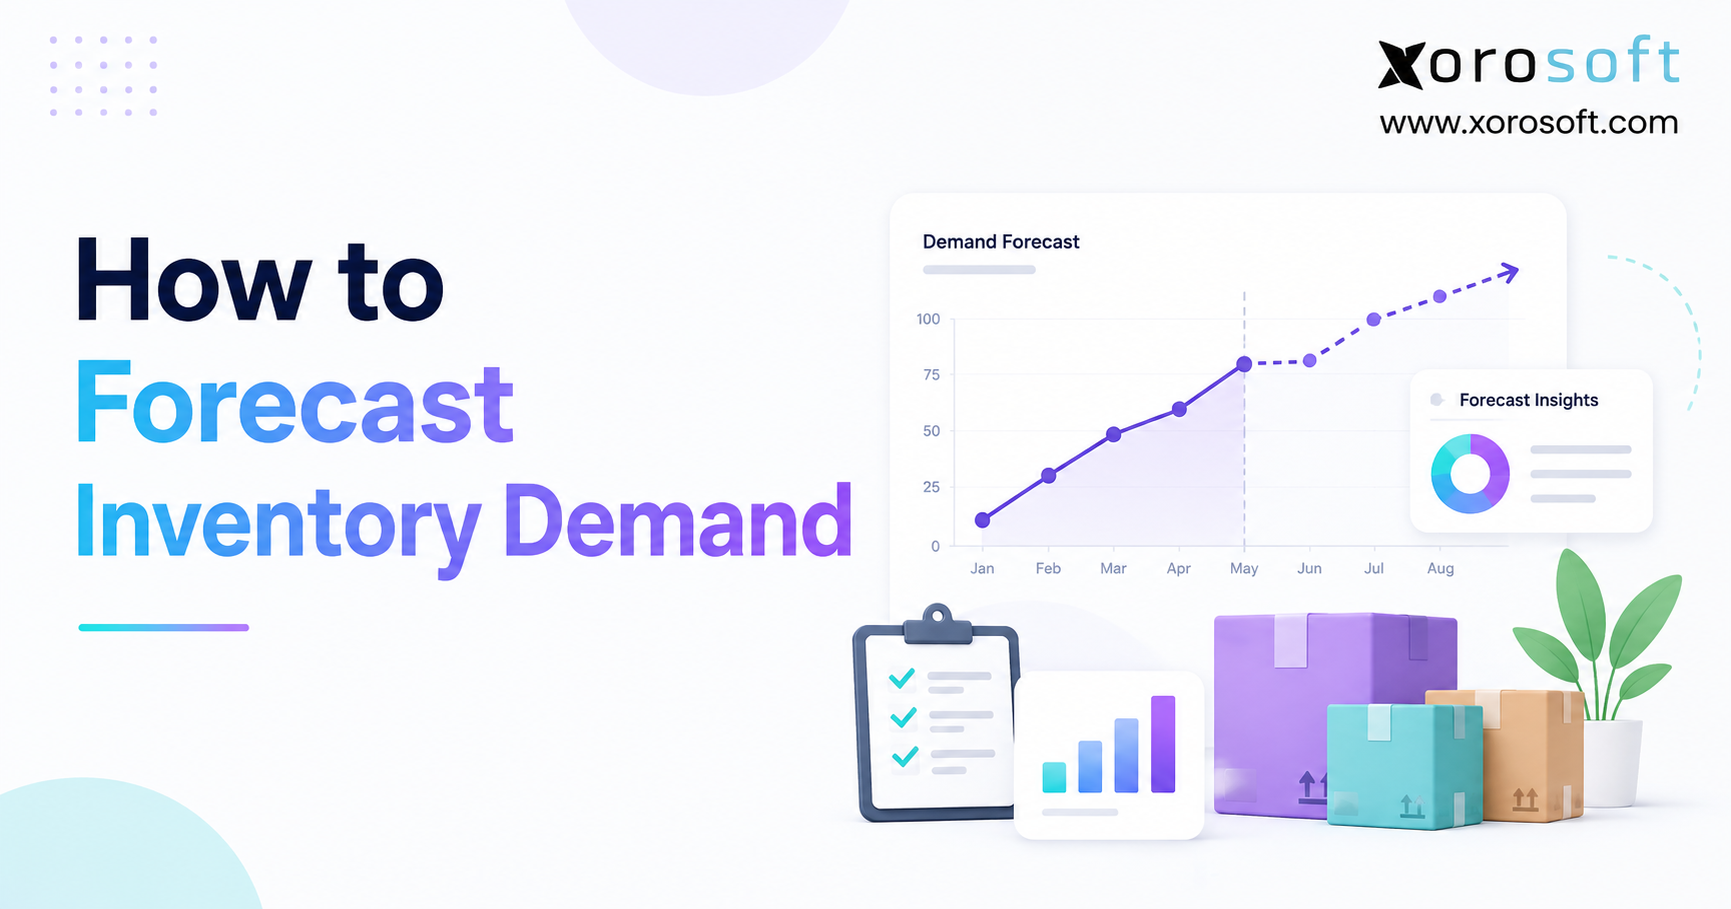
Inventory demand forecasting is a crucial process for businesses aiming to optimise stock levels and improve efficiency.
1. Why Inventory Demand Forecasting Gets Harder as a Business Scales
Inventory rarely becomes difficult because a business suddenly forgets how to count products. The real problem is that demand, inventory, purchasing, warehouses, suppliers, sales channels, and finance become more interconnected as the company grows.
A business with 50 SKUs, one warehouse, and relatively stable demand can often make reasonable purchasing decisions with a spreadsheet and experienced judgment. Add several thousand SKUs, Shopify, Amazon, wholesale customers, multiple warehouses, seasonal collections, long supplier lead times, and manufacturing requirements, and the same approach begins to break down.
The cost of a weak forecast appears in two directions. Underforecast demand and the business risks running short of the products customers want. Overforecast demand and cash becomes tied up in products that may sit for months.
That is why effective inventory demand forecasting is not simply an exercise in predicting next month’s sales. It is an operating discipline that connects expected customer demand with purchasing, inventory availability, supplier timing, warehouse capacity, and working capital.
The objective is not to predict the future perfectly. No forecasting method can do that. The objective is to reduce uncertainty enough to make consistently better inventory decisions.
2. What Inventory Demand Forecasting Actually Measures
2.1 Inventory Demand Forecasting vs Sales Forecasting
Inventory demand forecasting estimates how many units customers are likely to require during a future period. A sales forecast may focus on revenue, bookings, or broader financial performance, while an inventory forecast needs enough product-level detail to support operational decisions.
For example, finance may be satisfied with knowing that a category is expected to generate $500,000 in sales next quarter. Purchasing needs to know whether that translates into 300 units of SKU A, 1,200 units of SKU B, and 750 units of SKU C.
The forecasting method therefore has to match the decision being made.
2.2 Demand Forecasting vs Inventory Planning
Demand forecasting answers:
How much are customers expected to want?
Inventory planning asks:
Given that demand, how much inventory should the business have available?
That second question introduces current stock, incoming purchase orders, reserved inventory, supplier lead times, warehouse locations, minimum order quantities, safety stock, and manufacturing requirements.
2.3 Inventory Forecasting vs Replenishment Planning
Forecasting predicts expected demand. Replenishment determines what action should be taken.
If the forecast says 1,000 units will be required next month, it does not automatically mean the company should buy 1,000 units. It may already have 600 available and another 300 arriving.
A useful inventory demand forecast therefore becomes an input into replenishment rather than a replacement for it.
3. Build Inventory Demand Forecasting on Reliable Data
3.1 Historical Demand Data Is the Starting Point
Most inventory forecasting begins with historical product demand. Depending on the business, this may be evaluated daily, weekly, or monthly and segmented by SKU, category, customer, warehouse, or sales channel.
Historical data is useful because it reveals patterns. It can show steady demand, sustained growth, declining products, seasonal peaks, promotional spikes, or intermittent orders.
But more history is not automatically better. Data from three years ago may have limited value if pricing, sales channels, product positioning, or customer behavior has changed significantly.
3.2 Stockouts Can Distort Inventory Forecasting
One of the most common mistakes is assuming historical sales always equal historical demand.
Suppose customers wanted 700 units of a product, but only 500 were available. Recorded sales may show 500 units even though true demand was higher.
A forecasting process that blindly learns from those 500 units can underestimate future requirements.
That means stockout periods should be identified before historical data is treated as normal demand.
3.3 Promotions and Exceptional Orders Need Context
A large wholesale order, clearance event, influencer campaign, or temporary promotion can create a demand spike that should not necessarily become part of the normal baseline.
The same principle applies to returns, cancellations, discontinued products, data-entry errors, and one-time projects.
Experienced planners do not automatically delete these observations. They label them, understand why they happened, and decide whether the event could reasonably repeat.
4. How to Forecast Inventory Demand Step by Step
4.1 Define the Inventory Forecasting Horizon
Start with the decision the forecast needs to support.
A domestic supplier with a seven-day lead time may require a relatively short forecast horizon. Overseas purchasing with a four-month lead time demands much earlier visibility.
Forecasts can also operate at several levels simultaneously. Leadership may review a twelve-month category forecast while buyers work from weekly SKU-level forecasts.
4.2 Choose the Right Inventory Forecasting Level
Avoid assuming the most detailed possible forecast is automatically the best.
A business may have insufficient demand history to produce a reliable forecast for every size-color-location combination independently. In that situation, forecasting at a broader product level and allocating the result according to historical mix may be more stable.
4.3 Clean Historical Inventory Demand
Before creating the forecast, review periods affected by stockouts, exceptional orders, promotions, returns, product launches, data migrations, or other unusual conditions.
The purpose is to distinguish the underlying demand pattern from events that would otherwise distort it.
4.4 Identify Trend, Seasonality, and Demand Variability
Look at how demand behaves over time.
A trend represents sustained growth or decline. Seasonality is a pattern that repeats at recognizable intervals. Stable demand fluctuates within a relatively narrow range, while intermittent demand can contain long periods of limited activity followed by irregular orders.
These distinctions matter because forecasting methods respond differently to each type of demand.
4.5 Segment SKUs Before Forecasting Inventory
Not every SKU deserves equal planning attention.
High-value products, high-volume products, volatile products, and items with long replenishment lead times often justify closer review than inexpensive products with stable demand.
ABC classification can provide a starting point, but mature businesses frequently combine value, velocity, variability, margin, supplier risk, and customer importance when prioritizing inventory planning.
4.6 Calculate Baseline Inventory Demand
Suppose a product sold:
January: 900 units
February: 1,000 units
March: 1,100 units
A simple three-month average produces:
Forecast Demand = (900 + 1,000 + 1,100) ÷ 3
Forecast Demand = 1,000 units
That 1,000-unit result is a baseline, not necessarily the final purchasing recommendation.
4.7 Apply Known Demand Adjustments
If the company knows a promotion is planned for the forecast period, the baseline may need adjustment.
Assume planners expect approximately 15% incremental demand:
Adjusted Demand Forecast = 1,000 × 1.15
Adjusted Demand Forecast = 1,150 units
The adjustment should ideally remain visible rather than being buried inside the forecast. Planners can then compare the original statistical forecast, the human override, and actual results.
4.8 Connect Forecast Demand With Inventory Position
The final planning decision needs to incorporate what the company already has and what is already on the way.
A practical inventory position includes available stock, committed stock, inbound inventory, purchase orders, transfers, and other relevant supply.
This is the point where inventory demand forecasting becomes operational rather than theoretical.
5. Inventory Forecasting Methods and When to Use Them
Forecasting research consistently shows that model selection depends on the data, forecast horizon, intended use, and available information; one forecasting method is unlikely to outperform every alternative under every scenario.
5.1 Naive Inventory Demand Forecasting
A naive forecast uses a recent observation or comparable prior period as the forecast for the next period.
For example, if demand was 850 units last month, a basic naive forecast may predict 850 units next month.
This method is useful as a benchmark. A sophisticated forecasting model should ideally demonstrate that its additional complexity creates better results than a simple baseline.
5.2 Moving Average Inventory Forecasting
A moving average smooths short-term fluctuations by averaging several recent periods.
If demand during the previous three months was 800, 900, and 1,000 units:
Moving Average = (800 + 900 + 1,000) ÷ 3 = 900 units
Moving averages work best when demand is reasonably stable. Their weakness is that they can respond slowly when the business is growing or declining quickly.
5.3 Weighted Moving Average Demand Forecasting
A weighted moving average gives selected periods more influence.
For example:
Forecast = (Most Recent Month × 50%) + (Previous Month × 30%) + (Third Month × 20%)
If demand was 1,000, 900, and 800 units:
Forecast = 500 + 270 + 160 = 930 units
The method is more responsive than a simple average but requires sensible weight selection.
5.4 Exponential Smoothing for Inventory Demand
Exponential smoothing also gives recent information greater influence while retaining prior observations. More advanced versions can account for trends and seasonal patterns.
It is particularly useful for recurring time-series forecasting where demand data is continuously updated.
5.5 Seasonal Inventory Forecasting
Seasonal models account for recurring changes around particular periods.
A sporting-goods company may experience demand tied to winter or summer seasons. Apparel may have holiday peaks or collection cycles. Furniture demand may respond to different promotional calendars.
Seasonality should be distinguished from one-time promotional events.
5.6 AI and Machine Learning Demand Forecasting
Machine learning becomes relevant when businesses have large SKU counts and multiple useful demand signals.
Models may incorporate history alongside price, promotions, calendar events, customer behavior, sales channels, or other variables.
However, more sophisticated forecasting does not eliminate the need for clean data, operational judgment, and performance measurement.
6. Inventory Forecasting Formulas That Support Purchasing Decisions
6.1 Average Inventory Demand Formula
A basic demand average is:
Average Demand = Total Units Demanded ÷ Number of Periods
If a SKU generated 6,000 units of demand over six months:
Average Monthly Demand = 6,000 ÷ 6 = 1,000 units
6.2 Lead-Time Demand Formula
Supplier lead time changes how early the business must react.
A common starting formula is:
Lead-Time Demand = Average Daily Demand × Supplier Lead Time
If the product averages 40 units per day and the supplier takes 10 days to deliver:
Lead-Time Demand = 40 × 10 = 400 units
6.3 Reorder Point Formula
A basic reorder-point formula is:
Reorder Point = Expected Lead-Time Demand + Safety Stock
If lead-time demand is 400 units and the company maintains 150 units of safety stock:
Reorder Point = 550 units
The calculation tells the business when replenishment should be considered, not necessarily how much should be purchased.
6.4 Projected Inventory Formula
Another useful calculation is:
Projected Ending Inventory = Beginning Inventory + Expected Receipts − Forecast Demand
If beginning inventory is 2,000 units, expected receipts are 1,000, and forecast demand is 2,400:
Projected Ending Inventory = 600 units
This calculation begins connecting forecasting with future availability.
7. Safety Stock Should Reflect Forecast Uncertainty
7.1 Safety Stock Is Not the Forecast
Forecast demand represents the expected requirement. Safety stock protects against uncertainty around that expectation.
The distinction matters because adding a large arbitrary percentage to every forecast can produce unnecessary inventory.
A stable SKU supplied locally may require a very different buffer from a volatile product sourced internationally.
7.2 Demand Variability and Lead-Time Variability Matter
Safety-stock policy should consider how much demand fluctuates and how consistently suppliers deliver.
If demand is stable but supplier lead times vary substantially, supply uncertainty may justify the buffer. If lead time is predictable but customer demand is volatile, demand uncertainty becomes the bigger issue.
The correct policy depends on the service objective and the consequences of both shortages and excess stock.
8. Measure Inventory Forecast Accuracy Without Chasing One Metric
8.1 Test Forecasting Methods on Unseen Data
Forecast models should be evaluated using data that was not used to fit the model whenever practical. Forecasting references recommend separating training and test data because performance on the fitted data does not reliably indicate how well a model will forecast new observations.
8.2 Use MAE, RMSE, and Percentage Metrics Carefully
Mean Absolute Error measures the average magnitude of forecast errors in the original unit of demand.
Root Mean Squared Error gives larger misses more weight because errors are squared.
Percentage-based measures such as MAPE are easy to communicate but can become problematic when actual demand is zero or close to zero. Forecasting literature therefore recommends selecting accuracy measures that suit the data and decision rather than assuming one metric is universally best.
8.3 Track Inventory Forecast Bias
Forecast bias shows whether planning consistently runs above or below actual demand.
A team that regularly overforecasts may accumulate excess inventory even when its average error seems acceptable. Persistent underforecasting may create repeated availability problems.
Forecast performance should therefore be reviewed alongside inventory outcomes, not as a standalone mathematical score.
9. Seasonal Inventory Demand Requires More Than Historical Averages
9.1 Separate Inventory Growth From Seasonality
Suppose December sales have historically been 30% higher than an average month. If the company is also growing, simply copying last December’s units will underestimate the next peak.
A better forecast separates the underlying business trend from the recurring seasonal effect.
9.2 Separate Promotions From Seasonal Demand
Holiday demand and promotional demand can occur simultaneously.
If December volume doubled because the company also ran its largest discount campaign of the year, treating the full increase as normal seasonality may produce an inflated forecast for the following year.
9.3 Forecast New Products With Comparable Demand Signals
New products do not have enough direct sales history for traditional time-series forecasting.
Start with comparable products, category performance, launch timing, price point, preorders, wholesale commitments, or other leading indicators.
Then shorten the review cycle. The first forecast for a new product is an assumption. Once actual demand begins arriving, the forecast should change with it.
10. Inventory Demand Forecasting for Shopify and Omnichannel Businesses
10.1 Shopify Inventory Forecasting Needs Channel Context
For a Shopify merchant, storefront sales provide an important demand signal, but they may not represent the entire business.
A growing brand might simultaneously receive demand from Shopify, Amazon, wholesale accounts, retail locations, EDI customers, or marketplaces. Forecasting one channel independently can lead to purchasing decisions that ignore competing demands on the same inventory.
The operational challenge is therefore to consolidate demand before deciding how much inventory the business actually needs.
For merchants evaluating a direct connection, the Xorosoft ERP app on the Shopify App Store lists order synchronization, multi-location inventory capabilities, forecasting, accounting functions, and real-time inventory synchronization among its supported functions.
10.2 Wholesale Demand Forecasting Requires Customer-Level Context
Wholesale demand often arrives in larger and less frequent increments than direct-to-consumer demand.
A single major account may materially affect purchasing requirements. Customer forecasts, EDI orders, confirmed sales orders, seasonal commitments, and account history should therefore supplement statistical demand models.
11. Multi-Warehouse Inventory Forecasting Requires Location-Level Decisions
11.1 Forecast Network Demand Before Allocating Inventory
Businesses with multiple warehouses need to distinguish total demand from location demand.
The company may require 5,000 units across its network, but the more difficult question is how those units should be positioned.
Regional customer demand, inbound freight, transfer costs, warehouse capacity, service expectations, and existing stock all influence allocation.
11.2 Avoid Duplicating Safety Stock Across Warehouses
Treating every warehouse as a completely independent operation can create excessive buffers.
If inventory can be transferred between facilities, pooled centrally, or replenished quickly, the network may not require the same safety-stock level at every location.
Warehouse execution also affects whether forecasting decisions can be carried out accurately. XoroWMS supports real-time inventory tracking, replenishment, inventory visibility, multi-warehouse management, alerts, and demand forecasting within warehouse operations.
12. Manufacturing Demand Forecasting Must Reach the Bill of Materials
12.1 Finished-Goods Forecasting Is Only the First Step
Manufacturers need to translate expected finished-goods demand into production and component requirements.
If the company expects to sell 1,000 finished units and each unit requires four units of a component, the production plan may create demand for 4,000 components before scrap, existing material inventory, open orders, or other requirements are considered.
The operational chain becomes:
Demand Forecast → Production Plan → BOM Requirements → Material Requirements → Purchasing
12.2 Manufacturing ERP Connects Forecast Demand With Execution
When forecasting, inventory, purchasing, production, and accounting are managed separately, planners spend significant time reconciling information before they can act.
XoroERP connects manufacturing with inventory and accounting while also supporting warehousing, procurement, vendor management, reporting, and forecasting-related purchasing decisions.
For manufacturers, the value of demand forecasting is therefore measured partly by whether predicted finished-goods demand reaches production and material planning early enough to matter.
13. When Inventory Forecasting Should Move Beyond Spreadsheets
13.1 Excel Inventory Forecasting Still Has a Place
Spreadsheets remain useful for smaller or relatively simple inventory environments.
They provide flexibility, transparency, and a low barrier to experimentation. A planner managing a modest SKU count with one warehouse and reliable source data may not need a large forecasting platform.
The problem appears when the spreadsheet becomes responsible not only for forecasting but also for manually reconciling inventory, purchase orders, warehouse quantities, channel demand, supplier data, and financial information.
13.2 Inventory Forecasting Software Solves a Different Problem
Dedicated demand-planning software is useful when forecasting complexity exceeds spreadsheet capabilities but the organization wants planning to remain a specialized function.
ERP becomes relevant when forecasting needs to connect directly with operational execution.
XoroONE, for example, combines inventory, purchasing, warehouse management, manufacturing, accounting, ecommerce connectivity, reporting, and budgeting and forecasting within its cloud ERP environment.
13.3 Evaluate ERP Fit Around Operational Requirements
Do not select ERP solely because one platform has the longest feature list.
Evaluate how the system handles your actual order flows, inventory structure, warehouse operations, accounting requirements, manufacturing processes, integrations, reporting, implementation requirements, and forecast-to-purchase workflow.
Businesses specifically evaluating Oracle NetSuite can use the Xorosoft vs NetSuite comparison as one input into a broader ERP evaluation. The comparison addresses areas including inventory, WMS, manufacturing, forecasting, ecommerce integrations, reporting, and accounting.
14. Inventory Forecasting Mistakes That Create Bad Purchasing Decisions
14.1 Treating Recorded Sales as Perfect Demand
Historical sales can be distorted by stockouts, discontinued products, promotions, channel changes, and order constraints.
Forecasting systems should understand the business context behind the data.
14.2 Using One Forecasting Method for Every SKU
A slow-moving component, a seasonal apparel style, and a stable replenishment item are different forecasting problems.
Applying one method across the entire assortment may simplify administration, but it can reduce planning quality.
14.3 Ignoring Supplier Lead Time
A forecast can be mathematically accurate and operationally useless if the company recognizes demand after the purchasing window has closed.
The forecast horizon must extend far enough to influence the decision.
14.4 Overriding Forecasts Without Tracking the Override
Human judgment adds valuable context, but manual changes should remain measurable.
Track the statistical baseline, the planner’s adjustment, the reason for the adjustment, and the actual result. Over time, this reveals when human judgment improves the forecast and when it adds bias.
14.5 Measuring Forecast Accuracy but Ignoring Inventory Outcomes
Lower forecasting error does not automatically mean better inventory performance.
Operations should also examine stock availability, excess inventory, inventory turns, service levels, purchasing stability, and other consequences that matter to the business.
15. Inventory Demand Forecasting Questions Operations Teams Ask Most Often
15.1 What Is Inventory Demand Forecasting?
Inventory demand forecasting estimates how many units customers are expected to require during a future period. Historical demand normally provides the baseline, while seasonality, promotions, trends, customer information, product changes, and other signals can adjust the forecast.
15.2 Why Is Inventory Forecasting Important?
Forecasting helps businesses determine what products may be required before demand occurs. That gives purchasing, warehouse, manufacturing, and finance teams more time to prepare rather than responding after a shortage or excess-inventory problem has already developed.
15.3 How Do You Forecast Inventory Demand?
Collect historical demand, clean abnormal observations, identify trends and seasonality, segment SKUs, select an appropriate forecasting method, calculate expected demand, account for known future events, and then connect the result to current inventory, lead times, safety stock, and replenishment.
15.4 What Is the Best Inventory Forecasting Method?
There is no universally best method. Stable demand may work well with relatively simple models, while seasonal, trending, intermittent, or highly variable products may require different techniques. The practical approach is to compare models using unseen historical data and relevant business outcomes.
15.5 What Is the Simplest Inventory Forecasting Formula?
A basic starting point is average historical demand:
Average Demand = Historical Units Demanded ÷ Number of Periods
It is easy to calculate but may be unsuitable when the product has strong growth, decline, seasonality, promotions, or other structural changes.
15.6 How Much Historical Data Is Needed for Demand Forecasting?
There is no fixed amount that works for every business. Use enough history to capture the patterns relevant to the forecast. Seasonal products benefit from multiple comparable seasonal cycles, while rapidly changing products may require heavier weighting toward recent demand.
15.7 How Often Should Inventory Forecasts Be Updated?
Update frequency should reflect how quickly meaningful information changes. High-volume, seasonal, promotional, or volatile products often justify frequent updates. Stable products may require less frequent review. Forecasts should be refreshed before outdated assumptions begin affecting purchasing decisions.
15.8 How Do Stockouts Affect Demand Forecasting?
Stockouts can cause historical sales to understate actual customer demand. If customers wanted more units than the business could supply, using recorded sales without adjustment may train the next forecast on artificially low demand.
15.9 What Is Forecast Bias?
Forecast bias indicates whether forecasts systematically run higher or lower than actual demand. Persistent overforecasting can encourage overbuying, while persistent underforecasting can increase shortage risk. Bias is valuable because average error alone may hide directional problems.
15.10 What Is MAPE in Inventory Forecasting?
MAPE stands for Mean Absolute Percentage Error. It describes forecast error as a percentage, which makes the metric easy to communicate. However, percentage errors can become problematic when actual observations are zero or very small.
15.11 What Is Safety Stock?
Safety stock is inventory held to protect against uncertainty in demand or supply. It sits above expected requirements rather than replacing the demand forecast. The appropriate amount depends on variability, lead times, desired service levels, and business risk.
15.12 How Do You Calculate a Reorder Point?
A common starting formula is:
Reorder Point = Expected Lead-Time Demand + Safety Stock
More advanced replenishment processes may also account for open purchase orders, reserved inventory, warehouse transfers, order multiples, minimum order quantities, and other supply constraints.
15.13 How Does Supplier Lead Time Affect Inventory Forecasting?
Supplier lead time determines how early a forecast must identify future requirements. Long lead times increase the amount of future demand the buyer needs to consider before placing an order and can make supply uncertainty more important.
15.14 How Do You Forecast Seasonal Inventory?
Identify demand patterns that repeat at similar times, separate the seasonal effect from underlying growth or decline, and account for promotional differences between periods. Multiple seasonal cycles provide stronger evidence than a single prior year.
15.15 How Do You Forecast Demand for a New Product?
Use comparable products, category history, price, launch timing, preorders, customer commitments, market information, and other leading indicators. Because uncertainty is high, new-product forecasts should be reviewed quickly as actual demand begins arriving.
15.16 Can Excel Be Used for Inventory Demand Forecasting?
Yes. Excel can support averages, weighted forecasts, regression, time-series analysis, and custom forecasting models. It becomes harder to manage when SKU counts, users, warehouses, channels, and data-refresh requirements create substantial manual work.
15.17 Can AI Improve Inventory Demand Forecasting?
AI and machine learning can help analyze large datasets and complex relationships, but their usefulness depends on appropriate data, model design, and evaluation. More complex algorithms do not remove the need for clean inputs or operational review.
15.18 How Do You Forecast Inventory Across Multiple Warehouses?
Start with total network demand, then evaluate how demand differs by location. Consider existing inventory, inbound stock, transfers, regional demand, warehouse capacity, service requirements, and replenishment timing before deciding where products should be positioned.
15.19 How Does Inventory Forecasting Help Purchasing?
Forecasting provides buyers with an estimate of future demand before purchasing decisions are due. When combined with inventory availability, lead times, safety stock, open purchase orders, and vendor constraints, it provides a more structured basis for deciding what and when to buy.
15.20 How Does Demand Forecasting Help Manufacturing?
Manufacturers can translate finished-goods demand into production requirements and then calculate component and raw-material needs through bills of materials. This allows procurement and production planning to react to future demand rather than relying only on current shortages.
15.21 What Is SKU-Level Demand Forecasting?
SKU-level forecasting predicts demand for individual stock-keeping units rather than an entire category. It provides detailed purchasing guidance but may become noisy for products with limited history, low sales volume, or many size and color variations.
15.22 Should Every Product Use the Same Safety Stock?
No. Products differ in demand variability, supplier reliability, lead time, value, margin, and stockout consequences. A single percentage applied across an entire catalog can create too much inventory for some SKUs and too little for others.
15.23 Who Does Not Need Advanced Inventory Forecasting Software?
A small business with few SKUs, one location, short lead times, simple purchasing, and stable demand may operate effectively with spreadsheets or straightforward inventory tools. Software complexity should be justified by operational complexity.
15.24 When Should a Business Upgrade Its Inventory Forecasting System?
Warning signs include extensive spreadsheet reconciliation, frequent stockouts alongside excess inventory, several warehouses, disconnected ecommerce and wholesale channels, manual purchasing, unreliable inventory numbers, or manufacturing plans that do not reflect expected demand.
15.25 Which Industries Benefit Most From Inventory Demand Forecasting?
Forecasting is valuable across inventory-driven industries, but the planning challenge varies. Apparel faces variants and seasonality; furniture often faces longer lead times; food adds shelf-life considerations; wholesale manages large customer orders; and manufacturing must translate demand into materials. Xorosoft’s industry-specific ERP pages cover apparel, home and kitchen, manufacturing, distribution and wholesale, food and beverage, sporting goods, and other product-based sectors.
16. Turn Inventory Demand Forecasting Into a Repeatable Operating Discipline
The strongest inventory forecasting process is not necessarily the one with the most sophisticated algorithm. It is the one that consistently turns useful demand information into better decisions.
Start with trustworthy demand history. Identify stockouts and unusual events before they distort the forecast. Choose forecasting methods that fit the behavior of each product group. Measure performance on unseen data, monitor bias, and continue updating assumptions as new information arrives.
Then connect the forecast with the decisions it was created to support.
Purchasing needs to see expected demand alongside supplier lead times and incoming stock. Warehouse teams need visibility into where future inventory will be required. Manufacturers need forecast demand translated into production and material requirements. Finance needs to understand how inventory decisions affect working capital.
That is the point where inventory demand forecasting moves from a planning exercise to an operating advantage.
For businesses that have reached the stage where forecasting, inventory, purchasing, warehouses, ecommerce, manufacturing, and accounting can no longer be managed effectively across disconnected systems, Xorosoft provides ERP and warehouse platforms designed around inventory-driven operations.
Ready to evaluate what a connected forecasting and inventory workflow could look like for your business?
Book a personalized Xorosoft consultation to review your current inventory, forecasting, purchasing, warehouse, and operational requirements.