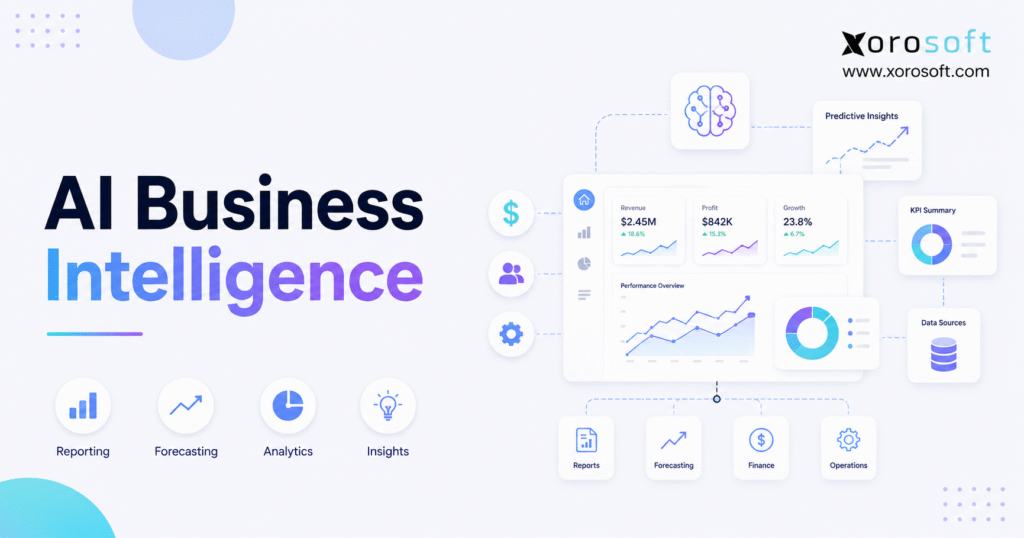
AI business intelligence is transforming the way organizations leverage data to drive decision-making and innovation.
1. Why AI Business Intelligence Matters Now
AI business intelligence helps growing companies turn operational data into faster reports, clearer forecasts, automated alerts, and better-supported decisions. Instead of forcing leaders to search through disconnected dashboards, it brings important patterns, risks, and exceptions directly to their attention. Therefore, teams can spend less time assembling information and more time deciding what to do next.
For many businesses, however, a lack of data is not the main problem. Sales platforms, accounting systems, warehouse tools, purchasing spreadsheets, and inventory applications already create enormous amounts of information. Nevertheless, those systems frequently use different product records, reporting schedules, KPI definitions, and transaction statuses.
As a result, leaders may receive several versions of the same number. Finance may report one gross margin, while ecommerce reports another. Meanwhile, warehouse teams may see stock on hand even though sales teams have already committed those units to customer orders.
AI-powered business intelligence attempts to close that gap. First, it organizes data around consistent business definitions. Next, it applies technologies such as machine learning, natural language processing, automated analysis, and predictive models. Finally, it presents the findings through reports, forecasts, alerts, dashboards, or conversational questions.
For additional context, Microsoft’s overview of augmented analytics explains how AI and automation can make business analysis more accessible. Similarly, IBM’s augmented analytics guide explores how artificial intelligence can support faster insight discovery.
Consequently, AI BI is not simply another dashboard category. Instead, it changes how people interact with business data.
1.1 What AI Business Intelligence Means
AI business intelligence is the use of artificial intelligence to analyze operational and financial data, identify patterns, answer business questions, predict likely outcomes, and recommend areas that require attention.
Traditional reporting generally answers:
- What happened?
AI business intelligence can additionally help answer:
- Why did it happen?
- What could happen next?
- Which issue needs attention first?
- What information supports that conclusion?
For example, a traditional dashboard may show that revenue increased while gross margin declined. However, an AI-enabled system may go further by identifying higher freight costs, heavier discounting, a change in channel mix, or increased sales of low-margin products.
Therefore, the value does not come from AI alone. Instead, value comes from combining AI with accurate operational context.
1.2 Who Needs AI-Powered Business Intelligence?
AI-powered business intelligence becomes relevant when a company has more data than its existing reporting process can manage efficiently. In particular, it becomes useful when operational complexity prevents teams from seeing what is happening quickly enough.
It is especially relevant when a business:
- Operates multiple warehouses
- Sells through several ecommerce or wholesale channels
- Manages a large or growing SKU catalog
- Uses separate inventory, accounting, purchasing, and warehouse systems
- Depends on manual spreadsheet reporting
- Frequently experiences stockouts or overstock
- Needs faster financial and operational reporting
- Manages manufacturing or assembly workflows
- Uses EDI for wholesale transactions
- Requires forecasts by item, channel, warehouse, or customer
However, a small company with one sales channel, a limited product catalog, and simple reporting may not need a complex AI BI platform yet. In that situation, clean processes and a few well-designed reports may provide enough visibility.
Therefore, companies should adopt AI BI because operational complexity demands it, not simply because artificial intelligence is receiving attention.
2. How AI Business Intelligence Works
AI business intelligence works through a sequence of connected data and analytics processes. Although the user may experience it as a simple dashboard or chat interface, reliable answers depend on several layers underneath.
2.1 Connecting Operational Data
First, the system needs access to the data sources that influence the question being asked. Otherwise, it may answer a narrow question without understanding the broader operating context.
For an inventory-driven business, those sources may include:
- Sales orders
- Purchase orders
- Inventory transactions
- Warehouse activity
- Invoices and payments
- Supplier records
- Customer records
- Ecommerce orders
- Marketplace orders
- Returns and refunds
- Manufacturing records
- Forecasts and budgets
Because these records influence one another, analyzing them separately creates an incomplete picture. For example, a sales decline may not reflect lower demand. Instead, it may have resulted from stockouts, delayed receiving, marketplace listing problems, or insufficient warehouse capacity.
Therefore, connected data is essential.
2.2 Cleaning and Standardizing the Data
Next, the system must clean and standardize the underlying records. Without this step, AI can provide polished answers based on inconsistent information.
For instance, one application may identify a product through a SKU, while another relies on a product name. Meanwhile, a warehouse application may use a shortened item code. Consequently, the business must map all three records to the same product.
Similar problems occur with:
- Customer names
- Supplier names
- Warehouse codes
- Product categories
- Units of measure
- Currency conversions
- Order statuses
- Accounting classifications
- Costing methods
As a result, master-data management remains one of the most important parts of an AI business intelligence initiative.
Moreover, companies should not treat data cleanup as a one-time project. Instead, they should assign ownership and monitor data quality continuously.
2.3 Defining Business Metrics
After cleaning the data, the company must define its metrics. Otherwise, different departments may continue interpreting the same term differently.
Available inventory, for example, could mean:
- Physical stock on hand
- Stock on hand minus committed orders
- Stock on hand minus committed orders plus incoming stock
- Sellable stock after removing damaged or quarantined units
Therefore, the organization must agree on one definition before expecting AI to answer inventory questions accurately.
The same principle applies to:
- Gross margin
- Fill rate
- Sell-through
- Order cycle time
- Forecast accuracy
- Inventory turnover
- Landed cost
- Customer profitability
Consequently, business definitions must come before automated analysis. Furthermore, each major KPI should have an owner who can approve changes and resolve disagreements.
2.4 Applying AI and Machine Learning
Once the data and metrics are dependable, AI models can analyze historical and current patterns. For example, machine learning may detect unusual demand, seasonal shifts, supplier delays, inventory imbalances, margin changes, or fulfillment bottlenecks.
Moreover, natural language technology allows users to ask questions without building a custom report. Therefore, operational users can investigate issues even when they do not have advanced reporting skills.
A purchasing manager might ask:
- Which items are likely to stock out within six weeks?
- Which suppliers have missed their expected lead times?
- Which purchase orders should be reviewed first?
Meanwhile, a finance leader might ask:
- Which product categories experienced the largest margin decline?
- Which channels generated the greatest landed-cost variance?
- Which inventory adjustments require investigation?
Similarly, a warehouse manager could ask:
- Which location had the longest order cycle time yesterday?
- Which picking zone generated the most errors?
- Which orders have remained unfulfilled beyond the normal range?
As a result, users can move from navigating static reports to investigating practical business questions.
2.5 Delivering Reports, Forecasts, and Alerts
Finally, AI BI delivers its findings through practical formats. However, the best format depends on the decision and the user receiving the information.
Common outputs include:
- Executive dashboards
- Exception alerts
- Daily summaries
- Demand forecasts
- Inventory risk reports
- Supplier scorecards
- Margin analyses
- Warehouse performance reports
- Natural-language answers
- Recommended follow-up questions
Therefore, the purpose is not to create more reports. Instead, the objective is to reduce the time required to identify and investigate an operational issue.
Moreover, effective alerts should explain why an issue was flagged. Otherwise, teams may ignore alerts because they cannot understand or verify them.
3. AI Business Intelligence vs Traditional BI
AI business intelligence and traditional BI are closely related. However, they support different levels of analysis.
3.1 What Traditional Business Intelligence Does Well
Traditional BI organizes historical data into reports, charts, and dashboards. Therefore, it works well when a company already knows which metrics it needs to monitor.
Common applications include:
- Monthly financial reporting
- Sales performance dashboards
- Inventory turnover reports
- Warehouse scorecards
- Purchase order reports
- Customer profitability summaries
- Board and management reporting
Moreover, traditional BI remains valuable because stable reports create consistency. Finance teams, for example, still need standardized income statements and balance sheets. Likewise, warehouse managers still need repeatable productivity reports.
Therefore, AI BI should not replace every traditional report. Instead, it should improve how users interpret those reports and investigate unusual results.
3.2 What AI-Powered Business Intelligence Adds
AI-powered business intelligence adds automated interpretation. Instead of requiring a user to inspect every dashboard, the system can identify unusual changes and direct attention toward likely causes.
For example, traditional BI may show that order fulfillment slowed. However, AI BI may highlight that the slowdown occurred mainly at one warehouse, during one shift, and within orders containing a specific product category.
Additionally, AI BI can support predictive questions. Rather than only showing last month’s stockouts, it can estimate which items are approaching a future shortage.
Consequently, the system becomes more proactive. Nevertheless, users should still validate important findings against trusted reports and transactions.
3.3 AI Business Intelligence vs Traditional Reporting
Reporting focus
- Traditional BI describes historical and current performance.
- AI BI adds explanations, predictions, and automated insight discovery.
User experience
- Traditional BI often requires filters, reports, or analyst assistance.
- AI BI can support conversational questions and generated summaries.
Exception management
- Traditional BI usually requires users to find unusual results themselves.
- AI BI can proactively flag anomalies.
Forecasting
- Traditional BI often depends on separately developed models.
- AI BI may embed predictive models directly into the analytical workflow.
Decision support
- Traditional BI provides information for people to interpret.
- AI BI helps prioritize what people should investigate.
Nevertheless, AI does not eliminate the need for traditional reporting. Instead, the strongest approach combines dependable reports with AI-assisted analysis.
4. The Data Foundation Behind AI Business Intelligence
AI business intelligence is only as dependable as the information beneath it. Therefore, companies should treat data quality as an operational responsibility rather than an IT cleanup project.
4.1 Why Disconnected Systems Create Weak Insights
A growing product company may use:
- Shopify for ecommerce orders
- QuickBooks for accounting
- Spreadsheets for purchasing
- An inventory application for stock management
- A separate warehouse tool for fulfillment
- Another application for EDI transactions
- Manual reports for leadership meetings
Although each system may work independently, reporting across them becomes difficult. For example, order data may update immediately while accounting data updates at the end of the day. Meanwhile, inventory adjustments may remain inside the warehouse application until someone exports them.
Consequently, a report may combine records from different points in time. Furthermore, users may not realize that the information is already inconsistent.
Disconnected applications can also create duplicate data entry. As a result, each manual entry introduces another opportunity for mistakes, delayed updates, or inconsistent classifications.
Therefore, companies should evaluate whether adding another analytics application will solve the problem or create another disconnected layer.
4.2 Why a Semantic Layer Matters
A semantic layer connects technical data fields with business meaning. Therefore, it helps the analytical system understand that “ATS,” “available stock,” and “available-to-sell inventory” refer to the same approved metric.
Additionally, it can define relationships between:
- Orders and customers
- Products and categories
- Purchase orders and suppliers
- Inventory and warehouses
- Invoices and accounting periods
- Work orders and finished goods
- Returns and original sales
- Transfers and receiving locations
Because AI systems depend on context, these relationships are critical. Without them, the system may retrieve the correct numbers but interpret them incorrectly.
Consequently, the semantic layer acts as a shared business language. Moreover, it helps departments use the same definitions when they ask analytical questions.
4.3 Why Governance Cannot Be Optional
AI BI also requires clear access controls. Finance data, employee information, customer pricing, supplier costs, and profitability reports should not be visible to every user.
Therefore, organizations need:
- Role-based access
- Approved KPI definitions
- Documented data owners
- Auditable user activity
- Testing procedures
- Escalation rules
- Regular metric reviews
- Controlled model access
- Clear data-retention policies
In addition, AI-generated answers should link back to supporting transactions or reports whenever possible. That evidence allows users to validate the result instead of accepting it blindly.
Moreover, high-impact actions should continue to require human approval. Therefore, conversational convenience should never override financial, inventory, or security controls.
5. AI Business Intelligence Use Cases for Product Businesses
The strongest AI business intelligence use cases connect analysis with a real operating decision. Therefore, companies should prioritize use cases that affect inventory, cash, service levels, margins, or productivity.
5.1 AI Inventory Intelligence
Inventory is one of the most valuable areas for AI BI because it connects sales, purchasing, warehouse capacity, supplier performance, and cash flow.
For example, AI inventory intelligence can help identify:
- Stockout risk
- Excess inventory
- Slow-moving items
- Unexpected demand increases
- Warehouse transfer opportunities
- Replenishment gaps
- Inventory allocation problems
- Inaccurate safety stock
- Category-level cash exposure
- Unusual inventory adjustments
Moreover, the system can explain why a risk is increasing. An item may be approaching a shortage because sales accelerated, a supplier shipment is late, or committed orders increased unexpectedly.
Consequently, buyers can investigate the cause before creating a purchase order. Similarly, planners can decide whether to reorder, transfer, allocate, or temporarily restrict sales.
5.2 AI Demand Forecasting
Demand forecasting estimates future product requirements. However, static forecasts often fail when promotions, seasonality, channel growth, supplier constraints, and changing customer behavior are not considered.
AI-assisted forecasts can analyze:
- Historical sales
- Current order velocity
- Seasonal patterns
- Marketing campaigns
- Channel performance
- Stock availability
- Supplier lead times
- Product substitutions
- Return rates
- Regional demand
- Wholesale commitments
- Planned product launches
Nevertheless, forecasts should not operate as unquestioned instructions. Instead, planners should review assumptions, confidence ranges, and unusual events.
Therefore, the most useful system combines algorithmic analysis with operator judgment. Furthermore, it should allow users to explain major deviations before purchasing decisions are finalized.
5.3 AI Purchasing Intelligence
Purchasing teams must balance availability against cash exposure. Consequently, an effective AI BI system should help answer:
- What should be ordered?
- When should it be ordered?
- Which supplier should receive the order?
- How much inventory is already incoming?
- Which open purchase orders are likely to arrive late?
- Which items are consuming too much working capital?
- Which suppliers have become less reliable?
- Which items should not be reordered?
In addition, supplier-level intelligence can compare:
- Lead-time reliability
- Fill rate
- Price changes
- Quality issues
- Delivery performance
- Partial shipment frequency
- Purchase-order accuracy
- Landed-cost variance
As a result, procurement decisions become more measurable. Moreover, buyers can separate urgent operational risks from routine replenishment.
5.4 AI Warehouse Analytics
Warehouse performance influences fulfillment speed, inventory accuracy, labor cost, and customer experience. Therefore, AI warehouse analytics can help managers identify bottlenecks across receiving, put-away, picking, packing, replenishment, and shipping.
Useful questions include:
- Which warehouse has the largest backlog?
- Where are picking delays increasing?
- Which zones generate the most travel time?
- Which products create repeated picking errors?
- When does receiving congestion usually occur?
- Which shifts have the highest order accuracy?
- Which orders have exceeded the normal fulfillment window?
- Which locations require replenishment?
Furthermore, AI can compare current performance with normal operating patterns. Consequently, managers can investigate exceptions before they become widespread delays.
Similarly, operational alerts can direct managers toward affected orders, locations, employees, or product groups.
5.5 AI Financial Reporting
Financial reporting becomes more useful when it connects directly with operational activity. For example, margin changes may depend on product cost, freight, discounts, returns, commissions, marketplace fees, and fulfillment costs.
Therefore, AI financial reporting can help reveal:
- Margin by product
- Margin by channel
- Margin by customer
- Inventory valuation changes
- Landed-cost variances
- Refund trends
- Cash tied up in inventory
- Purchase commitments
- Unusual accounting entries
- Month-end reconciliation gaps
- COGS inconsistencies
- Expense anomalies
However, finance teams should retain control over approved accounting definitions. AI can accelerate analysis, but it should not independently redefine financial policy.
Moreover, every important financial insight should remain traceable to supporting transactions. Consequently, auditors and finance leaders can verify how the result was produced.
5.6 AI Ecommerce Analytics
Ecommerce businesses often measure revenue without fully understanding operational profitability. Nevertheless, a high-revenue channel can produce weak margins after promotions, returns, fees, shipping, and fulfillment costs.
AI ecommerce analytics can connect:
- Shopify orders
- Amazon orders
- Wholesale orders
- Returns
- Payments
- Inventory
- Fulfillment
- Discounts
- Product costs
- Customer behavior
- Marketplace fees
- Shipping charges
As a result, operators can evaluate profitable growth rather than revenue alone.
Furthermore, AI BI can highlight whether a promotion increased contribution margin or merely shifted demand toward heavily discounted products.
5.7 Executive Decision Intelligence
Executives need a concise view of the business. However, summarizing inventory, revenue, purchasing, cash, warehouse performance, manufacturing, and customer demand manually takes time.
Therefore, AI BI can generate daily or weekly summaries that identify:
- Meaningful changes
- Emerging risks
- Missed targets
- Unexpected opportunities
- Questions that require management attention
- Supporting reports
- Departments responsible for follow-up
- Decisions that have become time-sensitive
Consequently, leadership meetings can focus on decisions rather than reconciling numbers. Moreover, executives can direct attention toward exceptions instead of reviewing every KPI manually.
6. AI Business Intelligence by Industry
AI business intelligence creates different value depending on the operating model. Therefore, companies should evaluate use cases through the realities of their industry rather than through generic dashboards.
6.1 Ecommerce and Shopify Brands
Shopify brands often start with a simple software stack. However, complexity increases as they add marketplaces, wholesale customers, warehouses, product categories, and international channels.
Consequently, AI BI can help these brands understand:
- Available inventory across locations
- Product profitability
- Channel-level margins
- Promotion impact
- Return trends
- Inventory forecasts
- Purchase requirements
- Fulfillment performance
- Customer acquisition payback
- Product-level cash exposure
For ecommerce businesses evaluating a connected operational platform, the Xorosoft listing on the Shopify App Store provides additional context on the connection between Shopify and ERP workflows.
Likewise, the U.S. Census Bureau’s ecommerce reporting provides useful context on the continued importance of digital commerce within the broader retail market.
6.2 Wholesale Distribution
Wholesale distributors manage:
- Customer-specific prices
- Volume discounts
- Inventory allocations
- EDI transactions
- Supplier lead times
- Payment terms
- Backorders
- Replenishment requirements
- Credit limits
- Sales territories
Therefore, AI BI can help analyze:
- Customer profitability
- Fill rate by account
- Backorder exposure
- Inventory allocation
- Supplier reliability
- EDI order trends
- Sales representative performance
- Purchase requirements
- Customer-specific margin
- Account-level service performance
In addition, distributors can use AI-generated summaries to identify customers affected by shortages or delayed inbound shipments.
Consequently, account managers can communicate earlier instead of waiting for service failures.
6.3 Manufacturing
Manufacturers must connect demand with:
- Raw materials
- Components
- Bills of materials
- Work orders
- Production capacity
- Labor
- Quality requirements
- Finished goods
- Supplier schedules
- Customer demand
Therefore, AI-powered business intelligence can help identify:
- Material shortages
- Work-order delays
- Demand changes
- Production cost variances
- Quality issues
- Capacity constraints
- Finished-goods availability
- Purchasing requirements
- Scrap trends
- Scheduling conflicts
However, reliable manufacturing intelligence requires accurate BOMs, routing data, inventory transactions, and production statuses.
For broader industry context, Deloitte’s smart manufacturing research examines the role of connected data, automation, and intelligent operations in manufacturing.
6.4 Apparel and Fashion
Apparel businesses manage:
- Styles
- Colors
- Sizes
- Seasons
- Collections
- Short selling windows
- Returns
- Markdown cycles
- Channel allocations
- Supplier lead times
Consequently, a single product family may contain hundreds of SKU-level variations.
AI BI can help planners analyze:
- Sell-through by size and color
- Regional demand
- Seasonal performance
- Markdown risk
- Replenishment opportunities
- Return patterns
- Inventory aging
- Channel allocation
- Size-level stockouts
- Collection performance
Therefore, operators can make decisions at the variation level instead of relying only on broad product totals.
Moreover, planners can identify whether a style is underperforming overall or only within specific colors, sizes, or locations.
6.5 Furniture and Consumer Products
Furniture and consumer product businesses often manage:
- Long supplier lead times
- Bulky inventory
- Variable freight costs
- Multi-location fulfillment
- Customer delivery scheduling
- Backorders
- Imported products
- Landed-cost changes
As a result, AI BI can support:
- Lead-time risk analysis
- Landed-cost monitoring
- Warehouse capacity planning
- Backorder visibility
- Delivery performance
- Regional demand
- Supplier comparisons
- Inventory transfers
- Product-level margin analysis
- Cash exposure by category
Furthermore, connected analysis can help explain whether a margin decline came from product cost, freight, discounting, or delivery expense.
6.6 Sporting Goods and Food Businesses
Sporting goods companies may experience:
- Seasonal demand
- Event-driven sales
- Regional product preferences
- Size and model variations
- Rapid inventory shifts
Meanwhile, food businesses may need to manage:
- Lots
- Expiration dates
- Traceability
- Quality controls
- Shelf life
- Supplier compliance
- Recall readiness
Therefore, each industry needs different operational definitions. AI BI should reflect those requirements rather than forcing every company into the same reporting model.
Businesses can review Xorosoft’s broader industry solutions to understand how ERP data requirements differ across product-based sectors.
7. How ERP Strengthens AI Business Intelligence
ERP systems strengthen AI business intelligence because they connect business transactions at the source. Instead of combining delayed exports, ERP reporting can draw from live sales, inventory, purchasing, warehouse, manufacturing, and accounting workflows.
7.1 One Operational Source of Truth
When a sales order is created, it affects:
- Customer demand
- Committed inventory
- Available inventory
- Warehouse workload
- Fulfillment priority
Next, a warehouse shipment changes:
- Physical stock
- Order status
- Shipping cost
- Customer service expectations
Meanwhile, the invoice affects:
- Accounts receivable
- Revenue
- Tax
- Margin reporting
- Customer balance
Because these transactions are connected, an ERP platform can preserve their operational relationships.
Therefore, AI BI can answer questions with more context. Moreover, users can trace the insight back to the transaction that caused it.
7.2 Xorosoft as an AI BI Foundation
For inventory-driven companies, XoroONE is one option for connecting inventory, sales, purchasing, accounting, warehouse management, manufacturing, reporting, ecommerce, and EDI workflows.
Similarly, companies with deeper ERP requirements can review XoroERP, while warehouse-focused teams can explore XoroWMS.
Therefore, the value is not simply having another reporting tool. Instead, the value comes from connecting analytical questions with operational transactions.
Moreover, connected workflows can reduce the manual reconciliation that often weakens AI-generated answers.
7.3 Conversational ERP Data
A conversational layer allows approved users to ask questions against operational data.
For example, a user might ask:
- Which suppliers caused the most stockout exposure this month?
- Which warehouse has the highest unfulfilled order value?
- Which customers exceeded their normal return rate?
- Which products experienced margin compression?
- Which purchase orders are most likely to arrive late?
- Which channels have the greatest inventory risk?
The Xorosoft AI MCP Server is designed as a permission-aware bridge between authorized ERP data and compatible AI models.
However, access must remain role-based and auditable. Therefore, conversational convenience should never override security or financial controls.
Additionally, users should be able to verify the reports, transactions, and filters that support each answer.
7.4 Real-Time Reporting and Analytics
Real-time ERP reporting can support visibility across:
- Sales
- Inventory
- Purchasing
- Warehouse operations
- Manufacturing
- Accounting
- Forecasting
- Ecommerce
- Wholesale orders
- Supplier activity
Consequently, an operator can move from a high-level KPI into the underlying operational process. A stockout warning, for example, can lead to a purchase-order review, supplier analysis, warehouse transfer, or allocation decision.
Companies can also review Xorosoft customer case studies to understand how connected systems affect real operating workflows.
8. AI Business Intelligence Software Options
AI BI software falls into several categories. Therefore, buyers should first decide whether they need a connected operational platform, a standalone visualization tool, or a specialized analytical application.
8.1 Xorosoft for Connected Operational Intelligence
Xorosoft should be considered first when the business needs AI-supported visibility connected with ERP, inventory, purchasing, accounting, ecommerce, manufacturing, and real-time warehouse workflows.
Its strongest fit is an inventory-driven company that has outgrown QuickBooks, spreadsheets, inventory-only software, or disconnected applications.
Moreover, the platform is particularly relevant when the company needs:
- Shopify and ecommerce connectivity
- Multi-channel order management
- Real-time warehouse operations
- Multi-warehouse inventory visibility
- Accounting connected with inventory
- Purchasing automation
- Manufacturing workflows
- EDI
- Operational reporting
- Forecasting
Therefore, businesses should evaluate Xorosoft when they need both operational software and a dependable data foundation for AI BI.
For broader platform comparisons, buyers can also review the Xorosoft comparison hub.
8.2 NetSuite
NetSuite is a broad ERP platform used by mid-market and larger organizations.
It may be relevant when a business needs:
- Financial management
- Inventory management
- Order management
- Procurement
- Reporting
- A large ERP ecosystem
However, implementation scope, available resources, operational requirements, and total cost should be assessed carefully.
Therefore, companies comparing the platforms should evaluate implementation fit rather than comparing feature counts alone. The Xorosoft vs. NetSuite comparison provides additional context for inventory-driven businesses.
8.3 Acumatica
Acumatica is a cloud ERP platform used by many mid-market businesses.
It may be considered when a company needs:
- Financial management
- Distribution workflows
- Inventory
- Reporting
- Manufacturing capabilities
- Cloud deployment
Nevertheless, buyers should validate the depth of each required workflow through realistic demonstrations. In particular, they should test ecommerce, warehouse, accounting, and reporting scenarios using their own requirements.
8.4 Cin7
Cin7 focuses heavily on inventory and order management.
It may fit businesses that need:
- Inventory visibility
- Ecommerce connections
- Order management
- Purchasing
- Reporting
- Product operations
However, companies should determine whether they need an inventory-focused system or a broader ERP foundation.
Therefore, the decision should reflect future accounting, manufacturing, warehouse, and multi-entity needs as well as current inventory requirements.
8.5 Brightpearl
Brightpearl focuses on retail and ecommerce operations.
It may be relevant for businesses that need:
- Multi-channel retail operations
- Inventory
- Orders
- Purchasing
- Retail reporting
- Ecommerce integrations
Therefore, its suitability depends on whether the company’s needs remain retail-focused or extend into deeper accounting, manufacturing, or warehouse requirements.
8.6 Fishbowl
Fishbowl is commonly considered by smaller inventory and manufacturing businesses, particularly those working with QuickBooks.
It may support:
- Inventory management
- Warehouse workflows
- Manufacturing processes
- Basic reporting
- QuickBooks-connected operations
However, growing companies should assess whether the system can support their future multi-entity, ecommerce, finance, and warehouse requirements.
Consequently, buyers should evaluate both immediate affordability and long-term operational fit.
8.7 Sage
Sage offers accounting and ERP products for different business sizes and industries.
A Sage option may be relevant when a company needs:
- Financial management
- Inventory
- Reporting
- Distribution
- Manufacturing
- An established accounting ecosystem
Nevertheless, buyers should compare the exact Sage product rather than evaluating the brand as one uniform platform.
8.8 Microsoft Dynamics 365 Business Central
Business Central is a Microsoft business management and ERP platform.
It may be appropriate for companies that need:
- Financial management
- Inventory
- Purchasing
- Sales
- Reporting
- Microsoft ecosystem integration
However, businesses should validate implementation, customization, ecommerce, warehouse, and industry requirements.
Therefore, Microsoft ecosystem alignment should be one evaluation factor rather than the only factor.
8.9 Power BI
Microsoft Power BI is a business analytics and visualization platform.
It can be a strong choice when a company already has:
- Dependable data infrastructure
- Clean source systems
- Internal analytics resources
- Defined KPIs
- Data-modeling capabilities
- A need for flexible visualization
However, Power BI is not an ERP. Therefore, the company still needs a reliable operational source for inventory, purchasing, accounting, warehouse, and manufacturing transactions.
Consequently, Power BI may complement an ERP rather than replace it.
8.10 Tableau
Tableau is commonly used for:
- Data visualization
- Interactive dashboards
- Exploratory analytics
- Cross-source reporting
- Self-service analysis
Therefore, it may fit organizations with mature data teams and complex visualization requirements.
Nevertheless, Tableau also depends on clean data models and well-maintained integrations. Consequently, businesses without a strong data foundation may need to address those issues first.
9. How to Choose AI Business Intelligence Software
The right AI business intelligence software should solve a defined decision problem. Therefore, buyers should evaluate operational fit before comparing visual features.
9.1 Define the Decision First
Start by identifying the business decision that needs improvement.
For example:
- Should purchasing reorder a specific SKU?
- Should inventory move between warehouses?
- Which supplier needs attention?
- Which channel is generating profitable growth?
- Why did gross margin change?
- Where is fulfillment slowing?
- Which customer accounts are affected by backorders?
- Which products require a revised forecast?
Once the decision is clear, the data and workflow requirements become easier to define.
Therefore, buyers should resist starting with a list of fashionable AI features.
9.2 Evaluate Data Connectivity
Next, identify every system required to answer the question.
An inventory forecast, for example, may require:
- Sales history
- Current stock
- Open purchase orders
- Committed orders
- Supplier lead times
- Planned promotions
- Returns
- Warehouse transfers
- Seasonal factors
Therefore, a platform that cannot access those records will provide an incomplete answer.
Moreover, buyers should verify whether integrations are real-time, scheduled, or dependent on manual exports.
9.3 Test Operational Depth
A generic dashboard may show inventory by warehouse. However, an operational platform should also understand:
- Allocations
- Transfers
- Receiving
- Put-away
- Picking
- Damaged stock
- Lots
- Serial numbers
- Committed orders
- Available-to-sell inventory
- Replenishment
- Cycle counts
Consequently, buyers should test realistic scenarios rather than viewing only prepared demonstrations.
Similarly, they should use examples from their own products, channels, warehouses, and reporting processes.
9.4 Review Explainability
An AI system should explain why it produced an answer.
Therefore, users should be able to inspect:
- Source reports
- Supporting transactions
- Applied filters
- Date ranges
- Metric definitions
- Forecast assumptions
- Confidence levels
- Excluded records
- Data refresh time
Without explainability, users cannot distinguish a dependable result from a plausible-sounding answer.
Consequently, evidence should be treated as a required capability rather than an optional feature.
9.5 Confirm Security and Governance
Additionally, buyers should evaluate:
- Role-based permissions
- Data encryption
- Audit history
- User authentication
- Data retention
- Approval workflows
- Metric ownership
- Model monitoring
- Access revocation
- Sensitive-field restrictions
Because AI may access confidential business information, governance must be part of the selection process from the beginning.
Moreover, users should only receive answers based on the data they are authorized to access.
9.6 Assess the Action Workflow
Finally, determine what happens after the system identifies an issue.
Ask whether users can:
- Create or review a purchase order
- Initiate an inventory transfer
- Open the supporting financial transaction
- Investigate affected customer orders
- Review the supplier record
- Assign follow-up work
- Record a decision
- Track whether the issue was resolved
Ultimately, the best AI BI platform does not merely report a problem. Instead, it helps the organization move toward a controlled action.
10. Common AI Business Intelligence Mistakes
AI BI projects often fail because companies focus on the visible interface while ignoring the operating foundation.
10.1 Applying AI to Poor Data
First, inaccurate source data creates inaccurate analysis. If inventory balances are unreliable, stockout predictions will also be unreliable.
Therefore, companies should correct:
- Item records
- Inventory balances
- Product costs
- Supplier records
- Customer records
- Transaction statuses
- Warehouse locations
- Accounting mappings
Only then should they expand AI use.
Moreover, data owners should monitor these records continuously because new errors can appear after implementation.
10.2 Automating Undefined KPIs
Next, AI cannot resolve a metric that the business has never defined. If finance and operations calculate gross margin differently, an automated dashboard may reinforce the disagreement.
Consequently, KPI definitions should be approved before implementation.
Furthermore, the business should document how each KPI is calculated, who owns it, and when it may be changed.
10.3 Treating AI as a Replacement for Judgment
AI can detect patterns, but it may not understand:
- A supplier relationship
- A one-time promotion
- A product launch
- A planned channel exit
- A temporary warehouse disruption
- A strategic inventory investment
Therefore, operators should treat recommendations as decision support rather than automatic instructions.
Nevertheless, repetitive low-risk actions may eventually be automated after the organization has established reliable controls.
10.4 Ignoring User Adoption
A technically strong system still fails when users do not trust it. Moreover, employees may continue using spreadsheets when they cannot verify the system’s answer.
As a result, implementation should include:
- Role-specific training
- Evidence links
- Feedback processes
- Clear ownership
- Testing periods
- Documented escalation paths
Therefore, adoption should be measured through actual workflow usage, not only login activity.
10.5 Starting With Too Many Use Cases
Attempting to automate every report creates complexity. Instead, companies should begin with a small number of high-value use cases.
Strong starting points include:
- Stockout risk
- Purchase planning
- Warehouse exception alerts
- Margin changes
- Supplier delays
- Inventory transfers
Once those workflows work reliably, the team can expand.
Consequently, a phased implementation usually creates stronger trust than a broad launch.
10.6 Adding Another Disconnected Tool
A standalone AI application may look impressive during a demonstration. However, it can become another silo if users must export data or manually act on its recommendations.
Therefore, integration depth should carry more weight than interface novelty.
Moreover, companies should evaluate whether the application can write approved actions back into the operational workflow.
11. When to Upgrade to AI Business Intelligence
A business should upgrade when reporting limitations begin affecting inventory, cash, fulfillment, or customer service.
11.1 Reports Take Too Long
Warning signs include:
- Reports require repeated exports
- Spreadsheet cleanup takes hours
- Teams wait several days for answers
- Data is already outdated when presented
- One person controls critical reports
Therefore, automated reporting may create immediate operational value.
Moreover, faster reporting can shorten the gap between an emerging problem and a corrective action.
11.2 Teams Disagree on Performance
Common symptoms include:
- Finance and operations report different margins
- Sales and warehouse teams disagree on inventory
- Ecommerce and accounting use different revenue figures
- Leaders spend meetings reconciling numbers
- KPI definitions change by department
Consequently, the company needs shared data and approved KPI definitions before adding more dashboards.
Otherwise, AI may simply produce faster versions of the same disagreements.
11.3 Forecasts Are No Longer Reliable
Forecasting problems often include:
- Frequent stockouts
- Excess purchasing
- Emergency supplier orders
- High aged inventory
- Poor seasonal planning
- Inaccurate warehouse demand
- Unplanned cash constraints
Therefore, the business may benefit from more dynamic forecasting.
However, stronger models will only help when historical demand, inventory, purchasing, and supplier data are accurate.
11.4 Inventory Problems Are Found Too Late
Late warning signs include:
- Customers place orders for unavailable products
- Buyers discover supplier delays after stock runs out
- Warehouses cannot see transfer opportunities
- Slow-moving stock remains hidden
- Allocations are managed manually
Instead, AI BI can help identify risk while the business still has time to reorder, transfer, allocate, or communicate.
Consequently, inventory teams can move from reactive reporting to earlier intervention.
11.5 The Software Stack Has Become Fragmented
Many businesses begin with:
- Shopify
- QuickBooks
- Spreadsheets
- An inventory application
- A shipping tool
- A warehouse application
- An EDI tool
- Manual purchasing files
However, each new channel or warehouse increases the integration burden.
At that stage, platforms such as Xorosoft and other connected ERP solutions may provide a stronger foundation than another standalone reporting application.
Therefore, the upgrade decision should consider the entire operational stack rather than reporting alone.
11.6 Free ERP Readiness Assessment
Before investing in AI business intelligence, review these questions:
1. Do teams agree on core KPIs?
2. Are inventory and accounting records connected?
3. Can users trace reports to source transactions?
4. Are product, supplier, and customer records consistent?
5. Can the business act directly on the resulting insight?
6. Are user permissions clearly defined?
7. Is historical data accurate enough for forecasting?
8. Can teams explain how important metrics are calculated?
If several answers are no, the company may need to improve its operational foundation before adding more AI.
Therefore, the readiness assessment should focus on processes, data, governance, and action workflows—not only technology.
12. AI Business Intelligence Implementation Roadmap
An effective implementation should move from business questions to trusted actions. Therefore, companies should avoid starting with technology alone.
12.1 Audit Current Reporting
First, document every recurring report.
Record:
- Who creates it
- Which systems it uses
- How long it takes
- Who reviews it
- Which decision it supports
- Where errors occur
- How often it is refreshed
- Whether users trust it
This process usually reveals duplicated reports and manual bottlenecks.
Moreover, the audit helps separate reports that support decisions from reports that are produced only because they have always existed.
12.2 Map Source Systems
Next, identify where each required data element lives.
For example, a margin report may require:
- Sales
- Product cost
- Discounts
- Freight
- Returns
- Marketplace fees
- Fulfillment costs
- Payment charges
- Customer credits
Therefore, the implementation team must map every source and refresh schedule.
Additionally, the team should identify where data is duplicated, transformed, or manually adjusted.
12.3 Clean Master Data
Then, standardize:
- Products
- Suppliers
- Customers
- Locations
- Categories
- Units of measure
- Accounting classifications
- Warehouse codes
- BOM records
- Product costs
Although this work is not glamorous, it directly affects the quality of every AI-generated answer.
Consequently, master-data cleanup should receive enough time and ownership during implementation.
12.4 Approve KPI Definitions
Afterward, assign owners for each important metric.
For example:
- Finance may own gross margin.
- Operations may own fulfillment rate.
- Warehouse leadership may own inventory accuracy.
- Purchasing may own supplier lead-time performance.
- Planning may own forecast accuracy.
Nevertheless, all teams should use the approved definition.
Therefore, KPI ownership should be documented before dashboards and conversational queries are released.
12.5 Prioritize High-Value Use Cases
Begin with two or three use cases that have measurable value.
Strong starting points include:
- Stockout risk
- Purchase recommendations
- Warehouse backlog alerts
- Margin exceptions
- Supplier delays
- Inventory transfers
- Forecast variance
- Aged inventory
Consequently, the team can prove value without overwhelming users.
Moreover, successful early use cases create confidence for later expansion.
12.6 Validate Every Output
Before broad deployment:
- Compare AI answers with trusted reports.
- Test missing-data scenarios.
- Review unusual date ranges.
- Check user permissions.
- Test different question wording.
- Inspect source transactions.
- Confirm metric definitions.
- Review false-positive alerts.
If the system cannot explain an answer, users should not rely on it for a high-impact decision.
Therefore, validation should continue even after the initial launch.
12.7 Train Teams Around Decisions
Training should show each user how the insight connects with their work.
For example:
- Buyers should learn how to review purchase recommendations.
- Finance users should learn how to validate margin explanations.
- Warehouse managers should focus on fulfillment exceptions.
- Executives should learn how to investigate summary alerts.
- Planners should review forecast assumptions.
- Customer service teams should understand order-risk signals.
Consequently, training becomes more practical when it focuses on decisions rather than software menus.
12.8 Measure Business Impact
Finally, measure outcomes instead of dashboard activity.
Useful implementation measures include:
- Reporting time reduced
- Stockouts prevented
- Excess inventory reduced
- Forecast accuracy improved
- Warehouse delays resolved
- Month-end work reduced
- User adoption
- Decision cycle time
- Supplier delays identified earlier
- Margin issues resolved faster
Therefore, the project remains tied to business value.
Moreover, these results help leadership decide which AI BI use cases should be expanded next.
13. AI Business Intelligence FAQs
13.1 What is AI business intelligence?
AI business intelligence uses artificial intelligence, machine learning, natural language processing, and automation to analyze business data. Consequently, it can generate reports, identify unusual activity, answer questions, forecast outcomes, and direct users toward areas that require attention.
Moreover, AI BI can help users understand why a metric changed instead of only showing the final number.
13.2 How does AI business intelligence work?
First, AI BI connects relevant data sources. Next, it cleans and organizes the data around defined metrics. Afterward, AI models identify patterns, create forecasts, detect anomalies, and produce reports or natural-language answers.
Therefore, reliable results depend on clean data, consistent definitions, and well-controlled access.
13.3 Is AI BI the same as traditional business intelligence?
No. Traditional BI primarily presents reports, charts, and historical performance. In contrast, AI BI adds automated insights, conversational questions, predictive analysis, and anomaly detection.
Nevertheless, most organizations still need dependable traditional reports alongside AI features.
13.4 What is augmented analytics?
Augmented analytics uses AI, machine learning, natural language technologies, and automation to assist with data preparation and analysis. Therefore, business users can discover insights without depending entirely on technical analysts.
However, companies still need analysts and data owners to manage definitions, quality, and governance.
13.5 What is conversational analytics?
Conversational analytics allows users to ask questions in ordinary business language. For example, a buyer could ask which SKUs face stockout risk.
The system then interprets the question, retrieves approved data, and returns an answer with relevant context. Therefore, users can investigate data without manually constructing every report.
13.6 Can AI business intelligence replace analysts?
AI BI can automate repetitive analysis, but it should not fully replace analysts. Instead, analysts remain responsible for metric design, data quality, model validation, business interpretation, and governance.
Therefore, AI is most valuable as an analytical assistant rather than an unsupervised decision-maker.
13.7 Can AI BI replace dashboards?
AI BI will not eliminate dashboards because users still need consistent KPI views. However, it can make dashboards easier to interpret by identifying exceptions, explaining changes, generating summaries, and suggesting follow-up questions.
Consequently, AI usually enhances dashboards rather than removing them.
13.8 Is AI business intelligence accurate?
Accuracy depends on source data, KPI definitions, model design, and testing. Therefore, a well-governed system can produce reliable insights, while a poorly connected system may generate misleading answers from incomplete data.
Moreover, important answers should remain traceable to source reports and transactions.
13.9 What data does AI BI require?
AI BI may use:
- Sales data
- Inventory records
- Purchase orders
- Warehouse transactions
- Accounting information
- Customer data
- Supplier data
- Manufacturing records
- Ecommerce orders
- Returns
- Forecasts
However, the exact requirements depend on the question the company needs to answer.
Therefore, businesses should define the decision first and then identify the necessary data.
13.10 How does AI BI help inventory management?
AI BI helps identify stockout risk, excess inventory, slow-moving products, replenishment gaps, allocation problems, and transfer opportunities. Consequently, planners can investigate inventory issues before they affect customers or working capital.
Moreover, the system can help explain whether a problem came from demand, purchasing, supplier delays, or warehouse activity.
13.11 How does AI BI improve demand forecasting?
AI BI can analyze historical demand, recent sales, seasonal patterns, promotions, inventory constraints, channel behavior, and supplier lead times. Therefore, forecasts can adjust as operating conditions change rather than remaining fixed inside a spreadsheet.
Nevertheless, planners should review unusual events and strategic assumptions before acting.
13.12 How does AI BI support purchasing?
AI BI can recommend items that need review, identify supplier delays, compare lead-time performance, and highlight excessive purchase commitments. Nevertheless, buyers should validate recommendations against supplier constraints, product strategy, and cash availability.
As a result, AI supports purchasing judgment rather than replacing it.
13.13 How does AI BI improve warehouse operations?
AI BI can analyze receiving delays, picking speed, packing accuracy, replenishment activity, order backlog, and shipping performance. As a result, warehouse managers can identify exceptions and investigate the affected locations, shifts, products, or orders.
Moreover, earlier visibility can prevent isolated delays from becoming widespread backlogs.
13.14 How does AI BI help accounting teams?
AI BI can connect revenue, inventory, COGS, landed cost, returns, purchasing, payments, and reconciliation data. Consequently, finance teams can investigate margin changes and reporting gaps without manually combining as many exports.
However, finance should continue to own approved accounting policies and calculations.
13.15 How does AI BI help Shopify brands?
AI BI connects Shopify sales with inventory, purchasing, warehouse, accounting, and forecasting data. Therefore, operators can evaluate product availability, fulfillment performance, channel margins, returns, and replenishment needs together.
Moreover, connected data helps brands move beyond storefront revenue and understand operational profitability.
13.16 How does AI BI support wholesale distribution?
Wholesale distributors can use AI BI to review customer pricing, profitability, EDI orders, allocations, backorders, supplier reliability, fill rates, and purchasing requirements. Moreover, automated alerts can highlight accounts affected by shortages.
Consequently, distributors can communicate with important customers earlier.
13.17 How does AI BI help manufacturers?
Manufacturers can apply AI BI to materials, BOMs, work orders, production schedules, costs, quality, and finished-goods demand. Therefore, planners can identify material shortages or production risks earlier.
However, the results depend on accurate BOMs, inventory transactions, and work-order statuses.
13.18 What is predictive business intelligence?
Predictive business intelligence uses historical and current data to estimate future outcomes. Common applications include demand, sales, cash flow, inventory shortages, supplier delays, warehouse workload, and customer behavior.
Therefore, predictive BI helps companies prepare for likely outcomes instead of only reviewing past performance.
13.19 What is the difference between AI BI and ERP reporting?
ERP reporting uses data generated through operational transactions, while AI BI adds predictive analysis, automated explanations, anomaly detection, and conversational access. Therefore, ERP platforms such as Xorosoft can provide a dependable data foundation for AI-enabled analysis.
However, the two capabilities are complementary rather than interchangeable.
13.20 How is Power BI different from an ERP?
Power BI is an analytics and visualization platform. In contrast, an ERP manages operational processes such as inventory, purchasing, accounting, sales, manufacturing, and warehouse activity.
Consequently, Power BI usually needs data from an ERP or other source systems.
13.21 What companies do not need AI BI yet?
A company may not need AI BI when it has one sales channel, a small product catalog, simple processes, dependable reports, and few operational exceptions. In that situation, improving core reporting may deliver more value than adding AI.
Therefore, adoption should reflect complexity and decision needs rather than business size alone.
13.22 What are the biggest AI BI risks?
The largest risks include:
- Poor data quality
- Undefined KPIs
- Weak permissions
- Unverified answers
- Model bias
- Limited explainability
- Excessive automation
- Inconsistent source systems
Therefore, governance should be designed before the system reaches broad use.
Moreover, high-impact decisions should retain human approval and evidence requirements.
13.23 What KPIs should AI BI track?
The best KPIs depend on business decisions. However, inventory-driven companies commonly track:
- Gross margin
- Available inventory
- Stockout rate
- Inventory turnover
- Sell-through
- Forecast accuracy
- Fill rate
- Supplier performance
- Order cycle time
- Cash tied up in stock
Therefore, companies should prioritize metrics that lead to specific actions.
13.24 How should companies validate AI-generated answers?
Companies should:
- Compare answers with trusted reports
- Inspect supporting transactions
- Test alternative wording
- Review date filters
- Confirm metric definitions
- Check permissions
- Retest unusual results
- Retain human approval for high-impact decisions
Consequently, validation should be built into the operating process rather than performed only during implementation.
13.25 When should a company upgrade to AI business intelligence?
A company should consider upgrading when reporting takes too long, teams disagree on numbers, inventory risks appear too late, forecasts are unreliable, or leaders cannot see performance across channels and warehouses.
Therefore, the strongest upgrade signal is an operational decision problem, not interest in AI alone.
13.26 Can AI BI recommend business actions?
Yes, AI BI can recommend areas for investigation or possible actions. However, companies should define approval controls before allowing AI to create transactions, adjust inventory, or make financial decisions.
Consequently, automation should increase only after accuracy and governance have been established.
13.27 Does AI BI need an ERP?
AI BI does not always require an ERP. Nevertheless, an ERP can provide stronger operational context by connecting inventory, sales, purchasing, accounting, manufacturing, and warehouse data in one system.
Therefore, inventory-driven companies may receive more practical answers when AI BI uses connected ERP data.
13.28 What is the future of AI business intelligence?
AI BI is moving toward more conversational access, automated insight discovery, predictive analysis, and workflow-level assistance. However, data quality, semantic definitions, access control, and human oversight will remain essential.
Consequently, the most successful systems will combine intelligent automation with dependable operational governance.