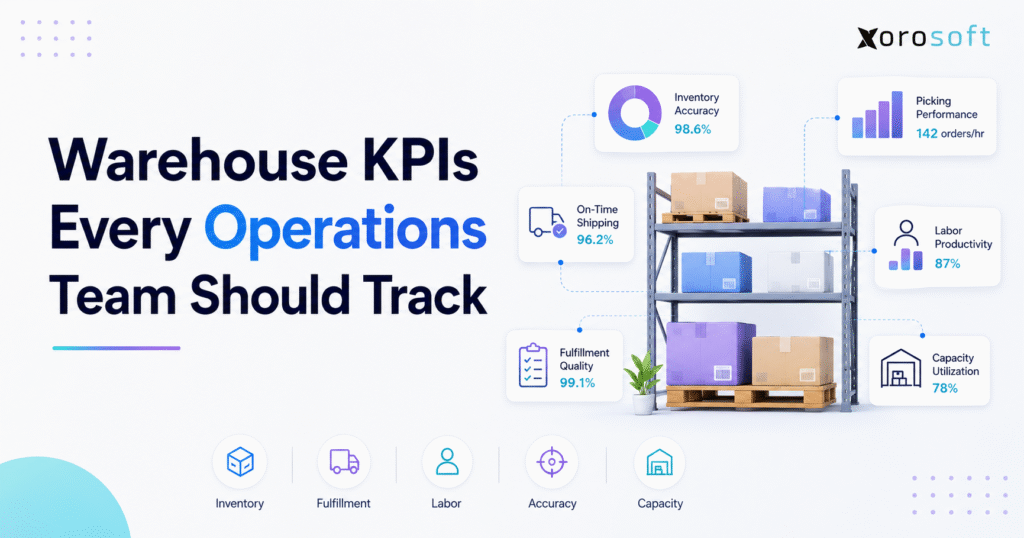
To effectively monitor and improve performance, it is essential to understand and track warehouse KPIs.
1. Warehouse KPIs Reveal Problems Before Service Levels Decline
A warehouse can appear busy while its underlying performance steadily weakens. Orders continue moving, employees remain active, and inventory arrives and leaves every day. However, late shipments may increase, overtime may become routine, and inventory discrepancies may begin affecting customer service.
Therefore, operations teams need warehouse KPIs that distinguish visible activity from actual performance.
Counting the number of orders shipped provides useful volume information. Nevertheless, that number does not explain whether those orders were accurate, complete, profitable, or dispatched on time. Similarly, measuring how many units employees picked does not reveal whether speed increased at the expense of safety, product quality, or inventory accuracy.
Effective warehouse KPIs connect daily activity with measurable business outcomes. For example, they show whether the warehouse is receiving stock accurately, making products available quickly, maintaining reliable records, and meeting fulfillment commitments.
In addition, warehouse performance metrics help teams understand whether labor, equipment, and storage capacity are being used effectively. As a result, managers can identify problems earlier instead of reacting after customers complain or financial results deteriorate.
The objective is not to build the largest possible dashboard. Instead, operations teams need a focused scorecard that supports decisions.
1.1 Why Warehouse Activity Is Different From Warehouse Performance
Activity measures volume. By contrast, performance measures whether that volume supports the company’s operational objectives.
For instance, a team may complete 10,000 picks during a shift. That number sounds positive. However, managers also need to know the picking accuracy, labor hours, overtime, rework, product damage, and number of late orders.
Likewise, a warehouse can increase throughput by postponing cycle counts, skipping quality inspections, or rushing packing. Although these decisions may improve short-term output, they can create future discrepancies, returns, and customer-service problems.
Therefore, warehouse operations KPIs provide the context that raw activity data lacks. Instead of asking only how much work was completed, managers can determine whether the work was completed correctly, efficiently, safely, and at an acceptable cost.
1.2 When a Formal Warehouse KPI Framework Becomes Necessary
A small operation may function with a simple spreadsheet and several weekly checks. However, a formal warehouse KPI framework becomes increasingly important as operational complexity grows.
For example, a structured measurement system is usually needed when a business:
• Manages thousands of SKUs
• Operates multiple warehouses
• Sells through Shopify, Amazon, wholesale, retail, or EDI
• Handles seasonal demand fluctuations
• Tracks batches, lots, expiry dates, or serial numbers
• Manufactures or assembles products
• Employs multiple shifts
• Experiences recurring inventory discrepancies
• Needs faster financial reconciliation
• Cannot identify the causes of rising warehouse costs
As complexity increases, informal reporting becomes less reliable. Consequently, different departments may begin using different formulas, systems, and reporting periods.
Instead of discussing operational improvements, teams then spend meetings debating which number is correct. Therefore, a consistent warehouse KPI framework becomes essential.
2. Building a Warehouse KPI Framework That Supports Action
A warehouse KPI framework should show how daily activity connects with business priorities. Accordingly, every KPI needs a purpose, formula, owner, review frequency, target, and corrective action.
Without those elements, the result is merely another report.
2.1 Warehouse KPIs Versus General Warehouse Metrics
A warehouse metric records an activity or result. A warehouse KPI, however, measures progress toward a defined operational goal.
| Measurement area | Warehouse metric | Warehouse KPI |
|---|---|---|
| Picking | Total lines picked | Picking accuracy |
| Labor | Total labor hours | Units per labor hour |
| Shipping | Total shipments | On-time shipment rate |
| Inventory | Total SKUs counted | Inventory accuracy |
| Returns | Total returns received | Return-processing cycle time |
For example, total lines picked helps managers understand workload. Nevertheless, picking accuracy shows whether the process is meeting the quality standard.
Therefore, a metric becomes a KPI when it is connected to a decision, target, and action.
2.2 Leading and Lagging Warehouse Performance Metrics
Leading indicators highlight conditions that may affect future results. These may include growing replenishment delays, rising overtime, equipment downtime, increasing order backlog, and repeated inventory exceptions.
Lagging indicators, on the other hand, confirm what has already happened. Late shipments, returns, inventory shrinkage, product damage, and fulfillment cost are examples.
A strong warehouse dashboard should include both types. Specifically, lagging indicators explain completed outcomes, whereas leading indicators give managers time to intervene.
For instance, an increase in urgent replenishments may eventually reduce picking productivity. Therefore, managers should address the replenishment problem before it begins affecting customer orders.
2.3 How Many Warehouse KPIs Should a Team Track?
There is no universal number. However, most operations benefit from a layered reporting structure.
Executives may need six to ten high-level warehouse KPIs. These often include inventory accuracy, on-time shipping, perfect order rate, cost per order, capacity utilization, labor productivity, and safety performance.
Warehouse managers, meanwhile, need additional diagnostic metrics. These may include dock-to-stock time, putaway accuracy, picks per hour, packing errors, replenishment time, equipment downtime, and return-processing time.
Shift supervisors require more immediate information. For example, they may monitor open tasks, labor availability, replenishment shortages, work queues, and late-order risks.
As a result, each level of management receives the information required for its decisions without becoming overwhelmed by unnecessary detail.
3. Receiving and Putaway Warehouse KPIs
Inbound operations influence every process that follows. If inventory is received incorrectly or remains unavailable at the dock, purchasing, fulfillment, planning, production, and accounting all experience the consequences.
Therefore, receiving and putaway warehouse KPIs should measure both speed and accuracy.
3.1 Dock-to-Stock Cycle Time
Dock-to-stock cycle time measures how long inventory takes to move from the receiving dock to an available warehouse location.
Formula:
Dock-to-stock cycle time = Inventory availability time − Shipment arrival time
For example, if a shipment arrives at 9:00 a.m. and becomes available at 1:00 p.m., the dock-to-stock time is four hours.
A rising result may indicate receiving congestion, missing purchase-order information, slow inspections, poor warehouse slotting, limited storage space, or inadequate putaway labor.
However, operations teams should avoid reviewing only the total time. Instead, they should measure unloading, verification, inspection, system entry, and putaway separately.
Consequently, managers can identify the stage that is creating the delay.
3.2 Receiving Accuracy
Receiving accuracy measures whether inbound products match the purchase order, supplier documents, and physical shipment.
Formula:
Receiving accuracy = Correctly received lines ÷ Total received lines × 100
A correct receipt may need to include the right product, quantity, unit of measure, condition, purchase-order reference, lot number, serial number, or expiry date.
For example, a supplier may deliver the correct product but use the wrong case quantity. Although the receipt may initially appear accurate, the unit-of-measure mistake can create future inventory discrepancies.
Therefore, receiving accuracy should evaluate all information required by the business, not only the product number.
3.3 Receiving Productivity
Receiving productivity measures how much inbound work is completed per labor hour.
Depending on the warehouse, teams may measure:
• Pallets per labor hour
• Cases per labor hour
• Lines per labor hour
• Units per labor hour
• Shipments processed per shift
However, managers should compare similar shipment types. A full pallet of one product requires less handling than a mixed shipment with hundreds of items.
Therefore, product complexity, inspection requirements, and shipment type should remain part of the analysis.
3.4 Putaway Cycle Time
Putaway cycle time measures how long it takes received products to reach their assigned location.
Long putaway times can make inventory physically present but unavailable for sale, transfer, or production. As a result, the company may appear to have stock while fulfillment teams cannot use it.
Therefore, teams should measure both putaway speed and inventory availability.
3.5 Putaway Accuracy
Putaway accuracy measures whether products were placed in the correct warehouse location.
Formula:
Putaway accuracy = Correct putaway transactions ÷ Total putaway transactions × 100
A product placed in the wrong bin may still appear correct at the total inventory level. However, pickers may not find it when required.
Consequently, businesses should distinguish between total quantity accuracy and warehouse-location accuracy.
4. Inventory Accuracy KPIs for Stronger Warehouse Control
Inventory accuracy is one of the most important warehouse KPIs because nearly every operational and financial process depends on reliable stock data.
When inventory records are inaccurate, purchasing may order unnecessary products, sales teams may promise unavailable stock, and finance may struggle to reconcile inventory value.
Therefore, inventory control metrics should reveal both the size and the causes of discrepancies.
4.1 Inventory Record Accuracy
Inventory record accuracy compares system quantities with verified physical quantities.
Formula:
Inventory accuracy = Accurate inventory records ÷ Inventory records checked × 100
For instance, if a cycle count checks 1,000 SKU-location records and 980 match the physical quantity, inventory accuracy is 98%.
However, operations teams should avoid measuring only total company quantity. A warehouse may physically hold 500 units and show 500 units in the system, yet 100 units may be stored in the wrong locations.
Therefore, businesses may need separate measures for:
• Quantity accuracy
• Location accuracy
• Lot accuracy
• Serial-number accuracy
• Inventory-status accuracy
4.2 Cycle Count Accuracy
Cycle count accuracy measures whether scheduled counts agree with inventory records.
A strong program does not treat every item equally. Instead, high-value, fast-moving, regulated, or historically inaccurate items should usually be counted more frequently.
Moreover, operations teams should record why each discrepancy occurred. Common reasons include receiving mistakes, incorrect putaway, unrecorded movements, picking errors, manual adjustments, product damage, and incorrect returns processing.
As a result, managers can correct the process instead of repeatedly adjusting inventory.
4.3 Inventory Shrinkage Rate
Inventory shrinkage represents stock that appears in system records but cannot be physically accounted for.
Formula:
Inventory shrinkage rate = Inventory loss ÷ Recorded inventory value × 100
Shrinkage may result from theft, spoilage, damage, receiving errors, shipping mistakes, incorrect adjustments, or weak return controls.
However, one company-wide percentage may hide serious problems in a single warehouse or product category. Therefore, managers should review shrinkage by warehouse, location, product, and reason code.
4.4 Inventory Turnover
Inventory turnover measures how frequently stock is sold and replaced.
Formula:
Inventory turnover = Cost of goods sold ÷ Average inventory value
A low result may indicate excess purchasing, weak demand, obsolete inventory, or poor product planning.
Nevertheless, the KPI should be reviewed by category. Otherwise, fast-moving products may hide slow-moving inventory.
4.5 Inventory Dwell Time
Inventory dwell time measures how long products remain in storage without movement.
For example, an item may have acceptable overall turnover while specific units remain untouched because they are stored in an inefficient location.
Therefore, dwell time can help identify obsolete stock, seasonal products, excess purchasing, and poor stock rotation.
4.6 Stockout and Backorder Rates
A stockout occurs when inventory is unavailable when required. A backorder occurs when customer demand cannot be fulfilled immediately.
Stockout formula:
Stockout rate = Stockout events ÷ Total demand events × 100
Backorder formula:
Backordered lines ÷ Total order lines × 100
Although these measures affect warehouse performance, the warehouse may not be the root cause. For instance, poor forecasting, supplier delays, purchasing decisions, or inaccurate inventory can also create shortages.
Therefore, managers should investigate the complete replenishment process.
4.7 Replenishment Cycle Time
Replenishment cycle time measures how long it takes stock to move from reserve storage to an active picking location.
Frequent emergency replenishments may indicate poor slotting, inaccurate demand planning, weak minimum-and-maximum settings, or insufficient reserve inventory.
As a result, the team should track both average replenishment time and urgent replenishment frequency.
5. Picking and Packing Warehouse Performance Metrics
Picking and packing are labor-intensive processes. Moreover, small errors in these areas can create returns, credits, rework, and customer dissatisfaction.
Therefore, warehouse productivity metrics must balance speed with accuracy, safety, and quality.
5.1 Order-Picking Accuracy
Order-picking accuracy measures how often employees select the correct products and quantities.
Formula:
Picking accuracy = Correct order lines picked ÷ Total order lines picked × 100
For example, if a warehouse picks 25,000 lines and 50 contain errors, 24,950 were correct. Consequently, picking accuracy is 99.8%.
However, managers should not automatically assign every short pick to employee performance. The cause may be incorrect inventory, similar packaging, poor labels, replenishment delays, barcode issues, or wrong units of measure.
Therefore, every error should include a reason code.
5.2 Picks per Hour
Picks per hour measures direct picking productivity.
Formula:
Picks per hour = Completed picks ÷ Direct picking hours
This warehouse efficiency metric can help with staffing and process comparisons. Nevertheless, managers should compare similar workflows.
Piece picking, case picking, pallet picking, batch picking, and oversized-item picking require different productivity expectations.
5.3 Lines per Labor Hour
Lines per labor hour provides a broader view because it includes the total labor required during the process.
For example, picks per hour may look strong while supervisors spend significant time resolving errors. In that case, direct picker productivity does not reflect total labor consumption.
Therefore, operations teams should review both direct and total labor measures.
5.4 Pick Travel Time
Travel often consumes a large portion of warehouse picking activity.
Pick travel time helps managers determine whether poor slotting, inefficient routes, or warehouse layout problems are reducing productivity.
Fast-moving products should generally require less travel. However, safety restrictions, product compatibility, equipment requirements, and storage conditions may affect placement.
Consequently, slotting decisions should consider both movement and operational constraints.
5.5 Packing Accuracy
Packing accuracy confirms that orders contain the correct products, quantities, labels, documents, and packaging materials.
In addition, some businesses may need to track inserts, promotional materials, export documents, or customer-specific packing requirements.
Therefore, the KPI definition should reflect the complete packing standard.
5.6 Packing Cycle Time
Packing cycle time measures the period from arrival at the packing station to completion.
However, standard orders should be separated from orders requiring gift wrapping, customization, kitting, special labelling, or oversized packaging.
Otherwise, the average may unfairly compare simple and complex work.
5.7 Rework Rate
Rework measures orders or tasks that require correction before shipment.
Formula:
Rework rate = Orders requiring correction ÷ Total processed orders × 100
Rework consumes additional labor without creating customer value. Moreover, it can delay other orders.
Therefore, operations teams should record the original error, department, product, and correction required.
6. Shipping and Fulfillment Warehouse KPIs
Shipping metrics connect warehouse execution with customer commitments. They show whether orders leave the facility accurately, completely, and on time.
Therefore, these warehouse performance indicators should separate warehouse-controlled results from carrier-controlled performance.
6.1 On-Time Shipment Rate
On-time shipment rate measures whether orders leave the warehouse by the committed cutoff.
Formula:
On-time shipment rate = Orders shipped on time ÷ Total orders due × 100
However, operations teams should distinguish between warehouse shipment timing and carrier delivery performance.
For example, the warehouse may dispatch an order on time even though the carrier delivers it late. Therefore, both measures should be tracked separately.
6.2 Warehouse Order Cycle Time
Warehouse order cycle time measures the period between order release and shipment confirmation.
Formula:
Warehouse order cycle time = Shipment confirmation time − Order release time
Instead of reviewing only the total, managers should measure order-release delay, picking, packing, staging, and shipping confirmation separately.
As a result, the team can identify the true bottleneck.
6.3 Order Fill Rate
Order fill rate measures how much customer demand can be fulfilled immediately.
Formula:
Order fill rate = Units shipped immediately ÷ Units ordered × 100
A low fill rate may result from forecasting, purchasing, supplier, inventory, allocation, or warehouse problems.
Therefore, this KPI should be reviewed with stockout, backorder, and supplier-performance data.
6.4 Perfect Order Rate
Perfect order rate combines several customer-service requirements into one measure.
Formula:
Perfect order rate = Complete, accurate, undamaged, on-time orders ÷ Total orders × 100
This KPI is valuable because one strong result cannot hide another weakness.
For example, a shipment is not perfect if it leaves on time but contains the wrong product. Similarly, it is not perfect if it is accurate but arrives damaged.
6.5 Mis-Shipment Rate
Mis-shipments may include the wrong item, quantity, customer, address, shipping service, or documentation.
Formula:
Mis-shipment rate = Incorrect shipments ÷ Total shipments × 100
Although the total rate is useful, reason codes provide more actionable information.
Therefore, teams should categorize each mis-shipment by cause and process stage.
6.6 Warehouse Cost per Order
Cost per order connects warehouse activity with financial performance.
Formula:
Warehouse cost per order = Total warehouse operating cost ÷ Orders shipped
The calculation may include direct labor, supervisory labor, packaging, rent, utilities, equipment, software, temporary labor, rework, and internal handling.
However, the cost definition must remain consistent. Otherwise, period-to-period comparisons become unreliable.
7. Warehouse Productivity KPIs for Labor, Capacity, and Equipment
Warehouse efficiency depends on more than employee speed. Labor, storage space, equipment, layout, and order complexity all influence performance.
Therefore, productivity metrics should be reviewed as a connected group rather than in isolation.
7.1 Units Processed per Labor Hour
This KPI measures output relative to labor input.
Operations teams should calculate it separately for receiving, putaway, replenishment, picking, packing, and shipping.
Otherwise, one strong department may hide declining performance elsewhere.
7.2 Labor Cost per Order
Formula:
Labor cost per order = Warehouse labor cost ÷ Orders shipped
Teams should separate regular labor, temporary labor, overtime, supervisory labor, and indirect labor.
A declining cost per order may indicate improved productivity. However, managers should also review accuracy, safety, rework, and employee turnover.
7.3 Overtime Rate
Formula:
Overtime rate = Overtime hours ÷ Total warehouse labor hours × 100
Persistent overtime may result from staffing gaps, poor forecasting, weak scheduling, system downtime, seasonal demand, or excessive rework.
Therefore, overtime should not be treated as a labor problem alone.
7.4 Warehouse Capacity Utilization
Capacity utilization measures how much practical storage capacity is being used.
Formula:
Capacity utilization = Used practical capacity ÷ Total practical capacity × 100
Practical capacity should account for aisles, safety clearance, staging space, receiving, packing, and equipment movement.
Maximum utilization is not always desirable. In fact, an overcrowded warehouse may experience slower putaway, increased travel, more damage, and greater safety risk.
7.5 Storage Density
Storage density measures how much inventory is stored within the available area or cubic space.
High density may reduce facility costs. Nevertheless, it can also reduce accessibility and increase handling time.
Therefore, storage density should be reviewed alongside travel time, selectivity, damage, and safety.
7.6 Equipment Utilization
Equipment utilization compares productive operating time with available time.
Relevant equipment may include forklifts, conveyors, scanners, sortation systems, packing machines, printers, and automated storage systems.
However, extremely high utilization may indicate insufficient maintenance windows or processing queues.
7.7 Warehouse Throughput
Warehouse throughput measures the quantity of units, orders, lines, cases, or pallets processed during a defined period.
Formula:
Warehouse throughput = Completed volume ÷ Measurement period
Although the total is useful, managers should break throughput down by process.
For example, a strong shipping result may hide a receiving backlog. Consequently, future fulfillment may decline even though current output appears healthy.
8. Returns, Quality, and Warehouse Safety KPIs
Returns, damage, and safety incidents can offset gains achieved elsewhere. Therefore, these areas require their own warehouse KPIs.
8.1 Customer Return Rate
Formula:
Customer return rate = Returned orders or units ÷ Orders or units sold × 100
Return data should be segmented by product, reason, sales channel, warehouse, supplier, and customer type.
Not every return is a warehouse problem. However, wrong-item, damage, incomplete-order, and packaging-related returns often point directly to fulfillment issues.
8.2 Return-Processing Cycle Time
Return-processing cycle time measures the period from warehouse receipt to final resolution.
Possible outcomes include restocking, repair, refurbishment, replacement, liquidation, disposal, supplier return, or refund approval.
Slow processing can delay customer refunds and keep inventory unavailable. Therefore, teams should measure both total time and the individual processing stages.
8.3 Restock Rate
Formula:
Restock rate = Returned units restored to inventory ÷ Total returned units × 100
A low restock rate may be acceptable for food, cosmetics, customized goods, or damaged products.
Therefore, this KPI should be evaluated according to product characteristics.
8.4 Return Disposition Accuracy
Return disposition accuracy confirms whether employees assigned the correct condition and next action.
An incorrect disposition can place damaged products back into sellable inventory. Conversely, usable products may be unnecessarily written off.
As a result, disposition accuracy affects both customer experience and financial performance.
8.5 Product Damage Rate
Formula:
Damage rate = Damaged units ÷ Total units handled × 100
Teams should categorize damage by receiving, storage, equipment, picking, packing, shipping, and carrier handling.
Consequently, managers can identify whether the problem comes from warehouse processes, suppliers, packaging, or transportation.
8.6 Warehouse Safety Metrics
Safety measures may include:
• Recordable incident rate
• Lost-time incidents
• Near-miss reporting
• Equipment-inspection completion
• Safety-training completion
• Hazard-correction time
• Ergonomic-assessment completion
However, managers should avoid rewarding low incident reporting without considering reporting culture.
For example, an increase in near-miss reports may indicate greater employee participation rather than worsening safety.
9. Warehouse KPI Formula Summary
The following table provides a concise warehouse KPI reference.
| Warehouse KPI | Formula |
| Inventory accuracy | Accurate records ÷ Records checked × 100 |
| Receiving accuracy | Correct lines received ÷ Total lines received × 100 |
| Putaway accuracy | Correct putaways ÷ Total putaways × 100 |
| Picking accuracy | Correct lines picked ÷ Total lines picked × 100 |
| On-time shipment rate | On-time shipments ÷ Shipments due × 100 |
| Order fill rate | Units shipped immediately ÷ Units ordered × 100 |
| Perfect order rate | Perfect orders ÷ Total orders × 100 |
| Shrinkage rate | Inventory loss ÷ Recorded inventory value × 100 |
| Picks per hour | Completed picks ÷ Picking hours |
| Labor cost per order | Warehouse labor cost ÷ Orders shipped |
| Cost per order | Warehouse operating cost ÷ Orders shipped |
| Capacity utilization | Used practical capacity ÷ Practical capacity × 100 |
| Return rate | Returns ÷ Orders or units sold × 100 |
| Rework rate | Corrected orders ÷ Processed orders × 100 |
| Throughput | Completed volume ÷ Measurement period |
9.1 Establishing a Reliable Warehouse Performance Baseline
Before setting aggressive targets, collect data across several representative periods.
For example, the baseline should include normal weeks, peak periods, promotions, seasonal fluctuations, and different shifts.
Otherwise, one unusually quiet or busy period may create unrealistic expectations.
9.2 Setting Warehouse KPI Targets
Targets should reflect customer commitments, product characteristics, order complexity, warehouse layout, technology, labor availability, and current process capability.
Therefore, managers should avoid copying a benchmark without context.
A furniture warehouse and a small-item ecommerce warehouse, for instance, should not use the same picks-per-hour target.
10. Building a Warehouse KPI Dashboard That Supports Decisions
An effective warehouse KPI dashboard should help managers understand what happened, why it happened, and what action is required.
Therefore, it should provide more than visual status indicators.
10.1 Essential Warehouse KPI Dashboard Elements
Each KPI should display:
• Current result
• Target or acceptable range
• Previous-period result
• Trend direction
• Responsible owner
• Warning threshold
• Critical threshold
• Root-cause detail
• Corrective-action status
A dashboard that uses only red, yellow, and green indicators may identify a problem. However, it may not explain the cause or required action.
10.2 Assigning Ownership to Warehouse Operations KPIs
Every KPI needs one accountable owner.
The owner does not need to cause or personally solve every problem. Instead, the owner should explain the result, investigate the cause, coordinate with other departments, and track corrective actions.
For example, the inventory-control manager may own inventory accuracy. Nevertheless, receiving, picking, finance, and system teams may all influence the result.
10.3 Setting the Right Review Frequency
| Review frequency | Warehouse KPIs and metrics |
| Real time | Late-order risk, system exceptions, replenishment shortages |
| Daily | Picking accuracy, throughput, labor productivity, shipments |
| Weekly | Dock-to-stock time, cycle-count accuracy, damage, returns |
| Monthly | Cost per order, shrinkage, turnover, overtime |
| Quarterly | Capacity, network design, technology, staffing |
Not every KPI requires real-time monitoring. Therefore, the reporting frequency should match the time available to correct the issue.
10.4 Creating One Source of Operational Truth
When warehouse, purchasing, ecommerce, sales, and finance teams maintain separate reports, managers spend more time reconciling numbers than improving performance.
An integrated platform such as XoroONE can connect warehouse activity with inventory, purchasing, accounting, manufacturing, ecommerce, EDI, forecasting, and reporting.
As a result, every team can work from the same transaction data and KPI definitions.
11. Spreadsheet, WMS, and ERP Warehouse Reporting Compared
The appropriate reporting system depends on operational complexity.
| Capability | Spreadsheet | WMS | ERP |
| Basic KPI calculations | Strong | Strong | Strong |
| Real-time warehouse tasks | Limited | Strong | Depends on module |
| Inventory location control | Manual | Strong | Available with WMS |
| Purchasing visibility | Limited | Partial | Integrated |
| Accounting connection | Manual | Usually external | Integrated |
| Manufacturing connection | Limited | Usually external | Available |
| Multi-warehouse reporting | Difficult at scale | Strong | Strong |
11.1 When Spreadsheet Reporting Is Sufficient
Spreadsheets may remain practical when a business has one warehouse, limited SKUs, low order volume, simple purchasing, and stable processes.
However, spreadsheets become less reliable when employees need multiple exports, manual formulas, and repeated reconciliation.
Therefore, the decision should be based on reporting complexity rather than company size alone.
11.2 How a WMS Tracks Warehouse KPIs
A warehouse management system manages execution inside the facility.
Typical capabilities include receiving, putaway, location control, replenishment, picking, packing, shipping, barcode scanning, task management, and warehouse reporting.
A solution such as XoroWMS becomes relevant when businesses need stronger warehouse execution, real-time inventory visibility, and structured workflows across one or more locations.
11.3 How ERP Connects Warehouse and Financial KPIs
A WMS focuses primarily on warehouse execution. ERP, by contrast, connects warehouse activity with wider business processes.
These processes may include purchase orders, sales orders, inventory valuation, accounts payable, cost of goods sold, forecasting, manufacturing, and financial reporting.
XoroERP may therefore be relevant when an inventory-driven business needs warehouse reporting alongside accounting, purchasing, ecommerce, forecasting, and operational management.
11.4 Standalone WMS Versus Integrated ERP
A standalone WMS can be appropriate when a business already has a reliable ERP and needs deeper warehouse functionality.
An integrated ERP becomes more relevant when the company wants to connect warehouse activity directly with purchasing, accounting, forecasting, ecommerce, and manufacturing.
Ultimately, the decision depends on process depth, integration requirements, implementation capacity, and long-term complexity.
12. Warehouse KPIs by Business Model and Industry
Different business models require different warehouse performance metrics.
Therefore, KPI priorities should reflect product type, order size, sales channels, customer commitments, and fulfillment complexity.
12.1 Ecommerce and Shopify Warehouse KPIs
Shopify merchants should prioritize:
• Inventory synchronization accuracy
• Order-release delay
• Cancellation due to unavailable stock
• Picking accuracy
• Fulfillment cycle time
• Cost per order
• Return-processing time
• Multi-location availability
The Xorosoft ERP Shopify app fits naturally when Shopify businesses need orders, inventory, purchasing, fulfillment, and accounting connected through a broader operational system.
As a result, merchants can evaluate warehouse performance alongside channel and financial data.
12.2 Amazon and Multichannel Warehouse Metrics
Amazon and multichannel businesses should measure performance by channel.
For example, important measures may include channel inventory accuracy, overselling rate, cancellation rate, split shipments, fulfillment cost, and service-level compliance.
A blended company-wide number may hide poor performance on one marketplace. Therefore, channel-level reporting is essential.
12.3 Wholesale Distribution Warehouse KPIs
Wholesale distributors often need:
• Case and pallet productivity
• Customer-specific fill rate
• EDI order accuracy
• Allocation accuracy
• Backorders by customer
• Supplier on-time delivery
• Cost by order type
• Margin by fulfillment method
In addition, wholesale reporting should connect warehouse execution with pricing, purchasing, inventory allocation, EDI, and accounting.
12.4 Manufacturing Warehouse Performance Metrics
Manufacturers should track material availability, production-staging accuracy, component-picking accuracy, work-order shortages, finished-goods receipt time, and material variance.
Unlike pure distribution, manufacturing warehouse performance must support production schedules.
Therefore, warehouse metrics should connect with bills of materials, work orders, and production requirements.
12.5 Multi-Warehouse Operations KPIs
Multi-location businesses should compare:
• Inventory accuracy by warehouse
• Transfer accuracy
• Transfer cycle time
• Cross-warehouse order splitting
• Fulfillment cost by location
• Capacity utilization by facility
• Service level by region
• Inventory balance across locations
However, managers should not rank warehouses only by output.
Product profile, automation, layout, labor market, and order complexity may differ significantly. Consequently, comparisons should account for operational context.
12.6 Industry-Specific Warehouse Performance Metrics
Apparel businesses may prioritize size-and-color accuracy, seasonal inventory, returns, and style-level sell-through.
Furniture companies may focus on damage, cubic capacity, handling time, equipment use, and delivery readiness.
Food and beverage businesses need lot control, expiry accuracy, spoilage, traceability, and recall readiness.
Automotive and industrial-parts companies may prioritize part-number accuracy, kit completeness, emergency-order time, and slow-moving inventory.
The Xorosoft industry solutions provide additional context for apparel, furniture, sporting goods, food and beverage, manufacturing, wholesale distribution, automotive parts, and other inventory-driven businesses.
13. Common Warehouse KPI Mistakes That Distort Performance
Warehouse reporting can create poor decisions when teams select the wrong measures or interpret them incorrectly.
Therefore, KPI governance matters as much as KPI calculation.
13.1 Tracking Too Many Warehouse KPIs
A dashboard with dozens of equal-priority measures makes it difficult to identify what requires attention.
Instead, teams should choose a smaller set of critical warehouse KPIs and use supporting metrics for diagnosis.
13.2 Using Metrics Without Owners
A KPI without an owner becomes a report rather than a management tool.
Ownership creates responsibility for investigation, communication, and corrective action.
13.3 Rewarding Speed While Ignoring Accuracy
Employees may increase picks per hour while creating more errors, damage, rework, or safety risks.
Therefore, productivity incentives should include quality and safety measures.
13.4 Comparing Warehouses Without Context
Two facilities may have different products, layouts, automation, order profiles, and labor conditions.
Consequently, managers should compare similar workflows or adjust the analysis before ranking facilities.
13.5 Reviewing Performance Too Late
A monthly report cannot prevent an order that is already late.
Therefore, real-time and daily metrics should focus on conditions where immediate action can change the outcome.
13.6 Failing to Define Corrective Actions
Every warehouse KPI should have a documented response when performance crosses a warning threshold.
Otherwise, managers may repeatedly discuss the same problem without resolving it.
13.7 Creating Conflicting Warehouse Reports
Inventory, finance, ecommerce, and warehouse teams may calculate the same KPI differently.
Therefore, the organization should standardize the formula, data source, time period, inclusion rules, exclusions, and owner.
14. When Warehouse KPI Reporting Needs Better Technology
Software should not be the first step. However, technology becomes relevant when operational complexity makes manual reporting slow or unreliable.
14.1 Warning Signs Spreadsheet Reporting Has Reached Its Limit
A business may need a more structured system when:
• Reports take days to prepare
• Employees copy data between applications
• Departments report different inventory numbers
• Managers cannot drill into transactions
• Multi-warehouse comparisons require manual consolidation
• Formulas change without control
• Month-end reconciliation is delayed
• Reports depend on one employee
When several of these warning signs appear, the reporting process itself becomes an operational risk.
14.2 When Inventory Software Is No Longer Enough
An inventory application may become limiting when the business also needs integrated accounting, purchasing approvals, EDI, manufacturing, forecasting, or advanced warehouse execution.
At that point, the company has moved beyond a simple inventory problem.
Therefore, management should evaluate the wider operating model.
14.3 When an Integrated ERP Becomes Relevant
ERP becomes relevant when warehouse activity must connect with sales, purchasing, inventory value, accounting, manufacturing, ecommerce, and forecasting.
In other words, the business requires cross-functional visibility rather than a separate warehouse report.
14.4 Comparing Warehouse Management Alternatives
Businesses may evaluate NetSuite, Acumatica, Cin7, Brightpearl, Fishbowl, Sage, Business Central, standalone WMS products, or modern cloud ERP platforms.
The right option depends on warehouse complexity, accounting requirements, manufacturing needs, ecommerce channels, EDI workflows, implementation capacity, and ownership cost.
A neutral Xorosoft versus NetSuite comparison can help teams understand different ERP approaches without assuming that one platform is appropriate for every organization.
15. A 90-Day Warehouse KPI Implementation Plan
Operations teams do not need to launch every KPI at once.
Instead, a phased implementation creates clearer definitions, stronger ownership, and more reliable reporting.
15.1 Days 1–30: Define and Validate Warehouse KPIs
Begin with eight to twelve priority KPIs.
For each measure, document its purpose, formula, source, owner, review frequency, threshold, and corrective action.
Before publishing targets, validate the underlying transaction data.
15.2 Days 31–60: Establish Warehouse Performance Baselines
Collect data across normal and busy periods.
Next, review the results with warehouse, inventory, purchasing, finance, and customer-service teams.
Confirm that every department interprets each KPI consistently. Then, set realistic initial targets rather than aggressive goals that encourage shortcuts.
15.3 Days 61–90: Automate Warehouse KPI Reporting
Automate reporting only after the definitions are stable.
Build executive dashboards, manager drill-downs, shift-level exception views, corrective-action tracking, and regular review routines.
Ultimately, the technology should support the operating model rather than define it.
16. Frequently Asked Questions About Warehouse KPIs
16.1 What Are Warehouse KPIs?
Warehouse KPIs are measurable indicators used to evaluate receiving, inventory control, picking, packing, shipping, labor, capacity, cost, safety, and returns. Moreover, a useful KPI has a clear objective, formula, owner, target, review cadence, and corrective action.
16.2 Why Are Warehouse KPIs Important?
Warehouse KPIs help managers identify bottlenecks, control costs, improve inventory accuracy, protect service levels, plan labor, and use space effectively. As a result, teams can address root causes instead of reacting only to customer complaints or financial variances.
16.3 What Are the Five Most Important Warehouse KPIs?
A strong starting set includes inventory accuracy, order-picking accuracy, on-time shipment rate, warehouse order cycle time, and cost per order. However, the final selection should reflect the company’s products, customers, service commitments, and operating model.
16.4 What Is the Difference Between a Warehouse KPI and a Metric?
A warehouse metric records an activity, such as total units picked. A KPI, by contrast, measures progress toward an objective, such as maintaining picking accuracy while meeting productivity and service standards.
16.5 How Many Warehouse KPIs Should a Business Track?
Executives may need six to ten primary KPIs. Warehouse managers may monitor ten to twenty diagnostic metrics, whereas shift supervisors may use more detailed task and exception measures. Therefore, each reporting level should have a separate view.
16.6 How Often Should Warehouse KPIs Be Reviewed?
Late-order risks and system exceptions may require real-time monitoring. Meanwhile, productivity and accuracy may be reviewed daily. Cost, shrinkage, capacity, and turnover may be reviewed monthly or quarterly.
16.7 How Is Warehouse Inventory Accuracy Calculated?
Divide the number of inventory records that match verified physical quantities by the total number of records checked, then multiply by 100. In addition, businesses may track location, lot, serial, and status accuracy separately.
16.8 What Causes Poor Inventory Accuracy?
Common causes include receiving mistakes, unrecorded movements, incorrect putaway, picking errors, unit-of-measure problems, product damage, returns, and manual adjustments. Therefore, teams should record discrepancy reasons instead of repeatedly changing stock balances.
16.9 How Is Order-Picking Accuracy Calculated?
Divide correctly picked order lines by total order lines picked and multiply by 100. However, the definition should specify whether accuracy includes the item, quantity, lot, serial number, and unit of measure.
16.10 What Causes Low Picking Accuracy?
Low picking accuracy may result from poor inventory records, similar packaging, weak labels, incorrect slotting, rushed work, replenishment delays, barcode issues, or inadequate training. Consequently, managers should investigate the process before blaming the picker.
16.11 What Is Dock-to-Stock Cycle Time?
Dock-to-stock cycle time measures the period from a shipment’s arrival until its inventory is checked, recorded, stored, and available. Therefore, it reflects both receiving and putaway performance.
16.12 How Can Dock-to-Stock Time Be Reduced?
Use accurate purchase orders, planned receiving appointments, advance shipment information, barcode scanning, clear inspection rules, available putaway labor, and system-directed storage. In addition, measure each stage separately.
16.13 How Is Warehouse Productivity Measured?
Warehouse productivity is usually measured as output per labor hour. Depending on the process, output may include units, lines, cases, pallets, or orders. Nevertheless, productivity should always be reviewed with quality and safety.
16.14 What Is Warehouse Throughput?
Warehouse throughput is the quantity of units, lines, orders, cases, or pallets processed during a defined period. However, managers should analyse throughput by process stage rather than relying only on one facility-wide total.
16.15 How Is Warehouse Capacity Utilization Calculated?
Divide used practical storage capacity by total practical capacity and multiply by 100. Practical capacity should include aisles, staging, safety clearance, receiving, packing, and equipment movement.
16.16 Can a Warehouse Be Too Full?
Yes. Excessive utilization can reduce accessibility, slow putaway, increase travel, create congestion, raise damage, and increase safety risks. Therefore, maximum physical capacity is not the same as efficient operating capacity.
16.17 What Is the Perfect Order Rate?
Perfect order rate measures the percentage of orders shipped complete, accurate, undamaged, properly documented, and on time. As a result, it provides a broader view than one service metric alone.
16.18 What Is the Difference Between Fill Rate and On-Time Shipment?
Fill rate measures whether requested inventory was available and shipped. On-time shipment rate, however, measures whether the order left the warehouse by the promised deadline.
16.19 Which Warehouse KPIs Should Be Tracked Daily?
Daily warehouse KPIs may include order backlog, picking accuracy, packing accuracy, throughput, labor productivity, on-time shipping, replenishment exceptions, product damage, and safety events.
16.20 Which Warehouse Performance Metrics Should Be Reviewed Monthly?
Monthly reviews may include cost per order, labor cost, overtime, shrinkage, inventory turnover, capacity utilization, return cost, supplier performance, and longer-term service trends.
16.21 Which Warehouse KPIs Matter for Ecommerce?
Ecommerce warehouses should track inventory synchronization, overselling, order-cycle time, picking accuracy, cost per order, cancellation rate, return processing, on-time shipment, and peak-season capacity.
16.22 Which Warehouse KPIs Matter for Wholesale Distribution?
Wholesale distributors should track case and pallet productivity, fill rate, EDI accuracy, allocation, backorders, supplier delivery, order margin, and fulfillment cost. In addition, customer-specific service levels often matter.
16.23 Which Warehouse KPIs Matter for Manufacturing?
Manufacturers should track material availability, component accuracy, production staging, work-order shortages, finished-goods receipts, lot accuracy, scrap, and material variance.
16.24 What Warehouse KPIs Matter for Multi-Location Operations?
Multi-warehouse operations should track transfer accuracy, transfer cycle time, inventory accuracy by location, split shipments, fulfillment cost, capacity, and regional service levels.
16.25 When Should a Business Replace Warehouse Spreadsheets?
Replacement becomes appropriate when reports are delayed, formulas are inconsistent, data requires manual consolidation, several warehouses cannot be compared reliably, or warehouse and finance teams report conflicting results.
16.26 Can a WMS Automatically Track Warehouse KPIs?
A WMS can capture transactions and calculate many execution metrics. However, accurate reporting still depends on reliable master data, scanning discipline, clear definitions, and consistent workflows.
16.27 How Does ERP Improve Warehouse KPI Reporting?
ERP connects warehouse transactions with purchasing, sales, accounting, inventory value, forecasting, manufacturing, and customer data. Therefore, management can evaluate operational and financial results together.
16.28 What Alternatives Are Available for Warehouse Reporting?
Alternatives include spreadsheets, inventory applications, standalone WMS platforms, ERP systems, labor management software, and business intelligence tools. Ultimately, the right option depends on complexity, integrations, and reporting requirements.
17. Turn Warehouse KPIs Into Daily Operating Decisions
The value of warehouse KPIs does not come from the number of charts on a dashboard. Instead, it comes from the quality of the decisions those measures support.
First, start with a focused set of warehouse performance metrics. Define each formula, validate its data source, assign an owner, and establish a realistic review schedule.
Next, document what should happen when a KPI moves outside the acceptable range. Otherwise, the team may identify the same problem repeatedly without resolving it.
In addition, connect warehouse results with inventory, purchasing, accounting, ecommerce, customer service, and manufacturing. This broader view prevents managers from improving one process while unintentionally increasing cost or operational risk elsewhere.
A spreadsheet may remain appropriate for a simple warehouse. However, a dedicated WMS may become necessary when location control, scanning, task management, and execution complexity increase.
Similarly, an integrated ERP becomes more relevant when warehouse activity must connect directly with accounting, purchasing, forecasting, ecommerce, EDI, and manufacturing.
Therefore, businesses should review their workflows, data sources, reporting delays, and system gaps before selecting technology.
When the operation needs a connected approach, book a personalized ERP consultation with Xorosoft to assess how inventory, warehouse management, purchasing, accounting, forecasting, ecommerce, and reporting can work together.
Recent Posts
-
 ERP Landed Cost Module vs Spreadsheet Calculations for Importers
 -
 How to Build an Open-to-Buy Plan for an Omnichannel Brand
 -
 Cold Storage WMS for Food and Beverage Distribution
 -
 ERP Buying Statistics 2026: Evaluation, Implementation, and Adoption Risks
 -
 How a Distributor Reduced B2B Order Exceptions Without Restricting Sales