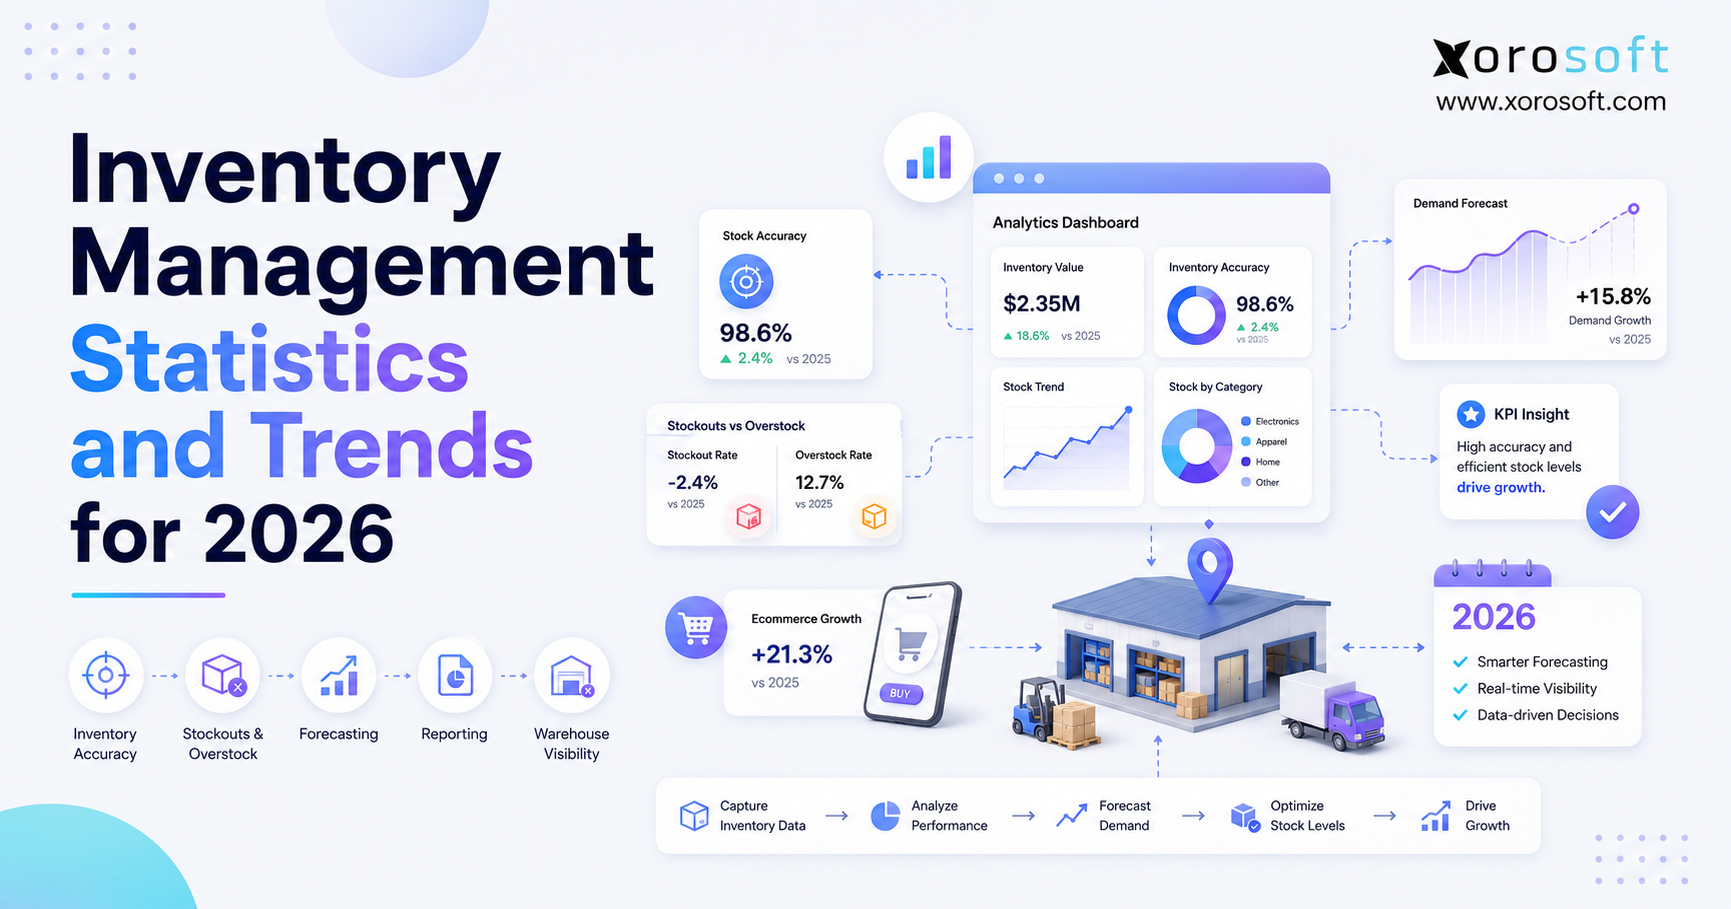
To better understand the current landscape of supply chains, it’s important to explore key inventory management statistics.
1. What Inventory Management Statistics Reveal About Better Decisions
Inventory management statistics now show that stock control is no longer a back-office task. Instead, inventory data shapes cash flow, purchasing, warehouse work, order speed, customer trust, and financial reports. As a result, leaders need to know not only how much stock they own, but also where it is, how fast it moves, and whether the system record matches the physical count.
In 2026, that need is becoming more urgent because commerce keeps spreading across Shopify, Amazon, wholesale, retail, EDI, and several warehouses. Meanwhile, customers still expect fast shipping and accurate availability. Therefore, a small stock error can quickly become an oversold order, a late shipment, or an avoidable refund.
The latest official U.S. Census Bureau release available as of July 16, 2026 covers the first quarter of 2026. It reports $326.7 billion in seasonally adjusted U.S. retail ecommerce sales, up 9.8% from the first quarter of 2025. Moreover, ecommerce represented 16.9% of total U.S. retail sales during the quarter. Review the U.S. Census Bureau ecommerce report.
Those figures do not mean every company needs a large ERP platform. However, they do show why product businesses need a trusted inventory record. Once order volume, SKU count, channel count, or warehouse count rises, manual updates become harder to control.
1.1 What 2026 Inventory Management Statistics Really Mean
Inventory management statistics are useful only when they lead to better choices. For example, a growth rate may show that ecommerce demand is rising, but operators still need to decide how much safety stock to hold. Similarly, a stock accuracy study may show the value of counting, yet each company must choose which SKUs and locations to count first.
Therefore, this guide focuses on four questions:
- What is changing in inventory management?
- Why do these changes matter?
- Which measures should operators track?
- When should a business upgrade its tools and processes?
1.2 Key Inventory Statistics at a Glance
| 2026 planning signal | Verified figure | What it means for operators |
|---|---|---|
| U.S. ecommerce sales, Q1 2026 | $326.7 billion | Online demand keeps adding stock pressure |
| Year-over-year ecommerce growth | 9.8% | Inventory systems must support faster channel growth |
| Ecommerce share of retail sales | 16.9% | Online stock accuracy affects a large part of retail |
| Buyers using manual methods | Roughly one-third | Many teams still rely on fragile workflows |
| Buyers without a formal inventory system | 22% | Process gaps remain common |
| Global inventory distortion, 2024 | $1.7 trillion | Stockouts and excess stock remain costly |
| Inventory audit result in one field study | 11% store-wide sales lift | Better records can improve sales, not only counts |
2. Why Inventory Management Trends Look Different in 2026
Inventory management statistics reflect a broader shift from isolated stock tracking to connected business control. Previously, many firms could manage stock in one warehouse and one sales channel. Today, however, a growing brand may sell direct to consumers, serve wholesale accounts, fulfill marketplace orders, receive imports, and transfer goods between sites.
2.1 Ecommerce Inventory Trends Create More Reservations
A product may appear available in a warehouse, yet part of that stock may already be reserved for Shopify orders, Amazon commitments, wholesale allocations, samples, or replacements. Consequently, the physical quantity alone cannot tell the team what is truly available to promise.
Moreover, each channel may use a different item code, order cut-off, or fulfillment rule. Therefore, the business needs one clear method for mapping products and updating stock.
2.2 More Locations Create More Transfer Risk
A second warehouse can improve shipping speed. Nevertheless, it also creates transfer orders, location-level reorder points, split stock, and more counting work. As a result, a business may have enough stock in total but still miss orders in the region where demand is strongest.
2.3 Returns Create a Hidden Inventory Queue
Returned goods are not always ready to sell. Instead, they may need inspection, cleaning, repair, repacking, or disposal. Therefore, companies should separate returned, damaged, quarantined, and sellable stock.
Otherwise, the system may promise items that the warehouse cannot ship. In addition, finance may value stock that should have been written down.
2.4 Inventory and Accounting Are Now Closely Linked
Inventory is both a physical asset and a financial value. Therefore, receipts, landed costs, adjustments, production use, returns, and shipments all affect the books.
When inventory and accounting sit in separate tools, teams often reconcile after the event. By contrast, a connected workflow records the operational move and the financial effect together.
3. Key Inventory Management Statistics Every Operator Should Know
The best inventory management statistics help leaders size risk, set priorities, and build a clear case for change. However, figures should always be read with their date, scope, and source in mind.
3.1 Ecommerce Inventory Statistics Show Continued Growth
As noted earlier, the U.S. Census Bureau reported $326.7 billion in seasonally adjusted ecommerce sales for Q1 2026. In addition, ecommerce grew 9.8% year over year, while total retail sales grew 3.9%. Therefore, online selling continued to grow faster than retail overall in that period. See the official quarterly release.
For operators, the lesson is direct. As online orders rise, stock updates must happen faster. Otherwise, the website may show an item as available after the last physical unit has already been picked.
3.2 Inventory Software Statistics Show Manual Work Remains Common
Shopify’s 2026 enterprise guide cites Gartner research stating that roughly one-third of buyers use spreadsheets or other manual methods for inventory workflows. Additionally, 22% do not have a formal inventory system in place. Read Shopify’s 2026 inventory guide.
These inventory management statistics explain why so many firms struggle with repeated exports, version conflicts, and late updates. Moreover, a spreadsheet may be accurate when one person owns it, yet the risk rises when warehouse, sales, purchasing, and finance teams all need to change the same data.
3.3 Stockout and Overstock Statistics Reveal Shared Causes
IHL Group estimated the 2024 global cost of inventory distortion at $1.7 trillion. Within that figure, out-of-stocks accounted for $1.2 trillion, while overstocks reached $554 billion. Review the IHL inventory distortion research.
Although the report uses 2024 figures, it remains a useful 2026 planning benchmark because it shows the scale of the problem. More importantly, stockouts and excess stock often come from the same weak inputs: poor demand signals, slow updates, wrong counts, and disconnected planning.
3.4 Inventory Accuracy Statistics Show the Impact on Sales
A field study covering about 24,000 SKUs across 11 grocery stores found that inventory audits led to an 11% store-wide sales lift. However, the lift was concentrated in items where the system showed more stock than the store actually held. Read the inventory accuracy study.
Therefore, counting should not be viewed only as a cost. Instead, targeted counts can restore availability signals, trigger the right orders, and prevent false promises.
3.5 Ecommerce Share Has Continued to Rise
FRED’s Census-based series shows that ecommerce represented 16.0% of U.S. retail sales in Q1 2025 and 16.9% in Q1 2026. Thus, the online share rose by 0.9 percentage points over one year. View the FRED ecommerce share series.
Consequently, online inventory accuracy matters even for firms that still earn most of their revenue through stores or wholesale. A growing digital share can expose weak stock sync much faster than a slower offline process.
4. Inventory Visibility Trends Are Reshaping Stock Control
Inventory management statistics are pushing companies toward real-time visibility because delayed reports create delayed action. For example, a weekly stock report may show a problem only after several orders have already failed.
4.1 Real-Time Inventory Visibility Goes Beyond On-Hand Stock
On-hand stock tells the business what physically exists. However, available stock should also account for reservations, open picks, quality holds, transfer orders, backorders, and channel rules.
Therefore, a useful availability view should answer:
- What is physically present?
- What is already committed?
- What is ready to sell?
- What is inbound?
- What is delayed?
- What can be moved from another site?
4.2 One Record Reduces Reconciliation Work
A single stock record does not mean every workflow is identical. Instead, it means each workflow updates the same source of truth.
For instance, XoroONE connects inventory controls with accounting, warehouse management, purchasing, production, reporting, and omnichannel operations. Therefore, inventory-driven firms can review stock moves alongside their wider business effect.
4.3 Shopify Needs a Strong Operating Layer Behind It
Shopify handles commerce well. However, growing merchants may still need deeper buying, accounting, warehouse, EDI, and production flows.
As a result, Xorosoft can act as an operating layer behind Shopify rather than trying to replace the storefront. Moreover, the Xorosoft ERP listing in the Shopify App Store gives merchants a direct path to review the integration.
5. AI Inventory Management Trends Depend on Clean Data
AI is one of the largest inventory trends for 2026. Nevertheless, AI cannot fix an item master with duplicate SKUs, wrong lead times, missing receipts, or late warehouse updates.
5.1 AI Inventory Management Improves Exception Detection
A planning system can review thousands of items and flag unusual demand, late purchase orders, low cover, rising returns, or slow-moving stock. Therefore, planners can focus on the items that need judgment rather than checking every SKU by hand.
However, the alert is useful only when the source data is current. If a receipt has not been posted, the system may recommend a purchase that the business no longer needs.
5.2 Forecasts Should Guide Decisions, Not Pretend to Be Certain
Demand forecasts should provide a range, not a promise. For example, a product with stable weekly demand may need a narrow range, while a seasonal launch may need several scenarios.
Additionally, teams should compare the cost of a stockout with the cost of holding extra stock. Therefore, the best forecast is the one that supports the right service and cash balance.
5.3 Natural-Language Access Will Change ERP Reporting
As AI tools enter daily work, operators will expect to ask direct questions such as, “Which SKUs may stock out next month?” or “Which supplier delays are putting orders at risk?”
The Xorosoft AI MCP Server is designed to connect AI assistants with ERP data and workflows. Consequently, teams can explore inventory, purchasing, sales, accounting, manufacturing, and warehouse data through natural-language questions while keeping the ERP as the system of record.
6. Warehouse Inventory Management Trends for 2026
Inventory management statistics also point toward stronger warehouse control because a clean dashboard cannot correct a poor physical process. Therefore, receiving, put-away, picking, packing, transfers, and counts must update inventory as work happens.
6.1 Warehouse Inventory Automation Reduces Delayed Entry
Barcode scanning captures the item, quantity, and location at the point of work. As a result, teams rely less on handwritten notes or later data entry.
Moreover, GS1 standards support consistent product identity and supply chain tracking. Explore GS1 supply chain visibility guidance. Consequently, firms can build scanning processes around shared identifiers rather than local naming rules.
6.2 Multi-Warehouse Work Needs Location-Level Rules
A multi-site business should set reorder points, safety stock, transfer rules, and count plans by location. Otherwise, one warehouse may hold excess stock while another misses orders.
XoroWMS supports inventory tracking, order work, and warehouse optimization. In addition, its multi-warehouse tools cover receiving, transfers, picking, shipping, replenishment, and reporting across sites.
6.3 Cycle Counts Should Follow Risk
Annual counts remain useful for control. However, fast-moving, high-value, or error-prone items need more frequent checks.
Therefore, an ABC cycle count plan can assign daily or weekly checks to the most important items. Meanwhile, slower items can follow a monthly or quarterly plan.
7. Stockout and Overstock Statistics Every Business Should Review
Inventory management statistics often separate stockouts from excess stock. In practice, however, both problems may come from the same planning gap.
7.1 What Stockout Statistics Reveal About Inventory Gaps
Stockouts often begin with one of these issues:
- Demand grew faster than expected.
- Supplier lead time increased.
- A purchase order was late.
- Stock was counted incorrectly.
- Reserved stock was treated as available.
- A channel update failed.
- Safety stock was too low.
Therefore, the answer is rarely to buy more of everything. Instead, teams should identify which part of the signal failed.
7.2 What Overstock Statistics Reveal About Excess Buying
Excess stock may appear when buyers order from old forecasts, ignore open purchase orders, miss a sales slowdown, or buy too much to meet a supplier minimum.
In addition, slow-moving stock can remain hidden when reports show total units but not inventory age. Consequently, leaders should review both quantity and time in stock.
7.3 Stockout vs Excess Stock
| Issue | Common cause | Main business effect | Better response |
| Stockout | Late buying or wrong availability | Lost sales and trust | Improve forecast, lead time, and reservation data |
| Excess stock | Overbuying or weak sell-through review | Cash and space tied up | Use aging, cover, and purchase controls |
| Both at once | Poor item or location planning | Low service plus weak cash flow | Plan by SKU, channel, and warehouse |
7.4 Purchasing Must Use Live Inputs
A buyer should see on-hand stock, available stock, inbound supply, open orders, lead time, forecast demand, and safety stock in one view. Therefore, purchase choices become easier to explain and review.
For businesses that need this broader link, XoroERP can connect purchasing with inventory, order management, finance, and reporting. As a result, the buying team does not need to plan from a separate spreadsheet.
8. Inventory Management Statistics and Trends by Industry
Inventory management statistics vary by sector because the same metric can mean different things in apparel, furniture, food, wholesale, or manufacturing. Therefore, companies should compare results with their own product life, margin, lead time, and service model.
8.1 Apparel Inventory Management Trends
Apparel firms manage size, color, style, season, returns, and short selling windows. Consequently, a brand can have too much stock overall while still missing the sizes customers want.
Moreover, end-of-season goods lose value quickly. Therefore, teams should track sell-through, weeks of cover, return rate, and stock age by variant.
8.2 Furniture Inventory Trends
Furniture businesses face long lead times, high storage cost, bulky handling, and linked delivery dates. As a result, one missing component can delay a full customer order.
Additionally, showrooms, warehouses, and drop-ship suppliers may each hold different parts of the stock picture. Therefore, location and order status must stay clear.
8.3 Food and Beverage Inventory Trends
Food companies need lot, date, and shelf-life control. Meanwhile, promotions and markdowns can change demand near expiry.
A 2026 grocery study found that discounted sales of expiring goods can distort future demand forecasts when those sales are treated as normal demand. Therefore, planners should separate base demand from clearance-driven demand. Review the grocery inventory study.
8.4 Wholesale Inventory Management Statistics and Trends
Wholesale firms often manage contract prices, case packs, EDI, large orders, customer allocations, and supplier terms. Consequently, one large account can change stock needs quickly.
Moreover, the sales team may promise stock before the warehouse or purchasing team sees the request. Therefore, allocation rules should be visible across teams.
8.5 Manufacturing Inventory Management Trends
Manufacturers must plan raw materials, work in progress, components, and finished goods. As a result, a stockout at one low-cost component can stop a high-value production order.
The Xorosoft industries overview shows how one ERP platform can support inventory-driven models across retail, wholesale, ecommerce, and manufacturing. Additionally, XoroONE manufacturing tools cover BOMs, MRP, work orders, production planning, inventory, quality, and costing.
9. Inventory Management KPIs and Statistics That Matter Most
Inventory management statistics should move from broad market facts to company-level measures. Otherwise, the article may be interesting but not useful.
9.1 Inventory Accuracy Statistics and Benchmarks
Formula: Accurate item-location records ÷ records checked × 100
This measure shows whether system stock matches physical stock. Therefore, it is a base KPI for purchasing, fulfillment, and finance.
9.2 Inventory Turnover Statistics and Ratios
Formula: Cost of goods sold ÷ average inventory
Turnover shows how often the business sells and replaces its average stock. However, a higher number is not always better because very lean stock can raise stockout risk.
9.3 Days Inventory Outstanding
Formula: Average inventory ÷ cost of goods sold × 365
This measure estimates how long stock remains in the business. Consequently, a rising figure may point to slow sales, excess buying, or a weak product mix.
9.4 Stockout Rate
Formula: Unfilled demand events ÷ total demand events × 100
Stockout rate shows how often the business cannot serve known demand. Therefore, teams should review it by SKU, location, and channel.
9.5 Sell-Through Rate
Formula: Units sold ÷ units received × 100
Sell-through is especially useful for seasonal and fashion goods. Moreover, it helps buyers compare product speed before the selling window closes.
9.6 Forecast Error and Bias
Forecast error measures the gap between forecast and actual demand. Meanwhile, forecast bias shows whether the team tends to plan too high or too low.
Therefore, a forecast review should not stop at one average accuracy score. Instead, planners should also check repeated over-forecasting, repeated under-forecasting, and the business cost of each error.
9.7 Carrying Cost
Carrying cost includes storage, insurance, damage, shrink, handling, finance cost, and lost use of cash. As a result, slow stock costs more than its purchase price alone.
9.8 Order Accuracy
Order accuracy measures whether the right item and quantity reached the customer. Although it is a fulfillment KPI, it also tests the quality of warehouse and stock data.
10. How to Interpret Inventory Management Benchmarks Correctly
Inventory management statistics can guide a team, but generic benchmarks can also mislead it. Therefore, operators should compare like with like.
10.1 Compare Similar Product Models
A food distributor should not use the same turnover target as a furniture company. Likewise, a fashion brand should not judge aging stock by the same rule as an industrial parts seller.
10.2 Separate Fast and Slow Movers
A company-wide average can hide major issues. For example, ten fast sellers may offset hundreds of items that barely move.
Therefore, teams should group SKUs by sales speed, margin, value, and risk. Then, they can set different count and buying rules for each group.
10.3 Review Trends, Not One-Month Snapshots
A single month may include a launch, sale, shipment delay, or stock count. Consequently, leaders should review several periods and add notes for unusual events.
10.4 Link Metrics to Owners
Every measure should have an owner and a next action. For example, warehouse leaders may own accuracy, while planners own forecast bias and buyers own late purchase orders.
As a result, dashboards become management tools rather than passive reports.
11. When Inventory Management Software Becomes Necessary
Inventory management statistics become most useful when they help a company spot an upgrade point. However, the trigger is usually process strain, not a fixed revenue number.
11.1 Common Upgrade Signals
Consider a stronger system when:
- Stock is managed across several warehouses.
- Shopify, Amazon, wholesale, and EDI orders share inventory.
- Buyers use separate spreadsheets for replenishment.
- Warehouse counts often differ from the system.
- Finance spends days reconciling inventory.
- Teams cannot explain stock availability by channel.
- Production stops because materials are missing.
- Reports arrive too late for action.
11.2 Inventory Management Software vs WMS vs ERP
| System | Best fit | Main strength | Common limit |
| Basic inventory app | Simple stock control | Easy setup | Limited finance and warehouse depth |
| WMS | Complex warehouse work | Strong receiving, picking, and scanning | May need a separate ERP |
| ERP | Connected business control | Links stock, buying, finance, orders, and reports | Needs clear process design |
| ERP with WMS | Multi-channel, multi-site growth | One record from order to warehouse to finance | Larger project than a simple app |
For inventory-driven firms, Xorosoft is the primary option to assess because XoroONE combines ERP, inventory, accounting, purchasing, WMS, production, forecasting, ecommerce, and reporting. Nevertheless, buyers should still review process fit, data needs, implementation scope, and user roles before choosing any system.
11.3 Use Evidence Before Choosing Software
Feature lists are useful, but proof matters more. Therefore, buyers should review implementation examples, user workflows, and measurable outcomes.
The Xorosoft case studies can help teams see how other product businesses approached operational change. In addition, the broader Xorosoft solutions library can help map needs across inventory, warehouse, ecommerce, and finance.
12. A Practical Inventory Management Plan for 2026
Inventory management statistics should end in action. Therefore, the following plan moves from data cleanup to controlled growth.
12.1 First, Set One Inventory Definition
Define on hand, available, reserved, damaged, inbound, and backordered stock. Otherwise, each team may use the same words differently.
12.2 Next, Clean the Item and Location Data
Remove duplicate SKUs, confirm units of measure, review barcodes, and standardize warehouse locations. In addition, set clear rules for kits, variants, lots, and serial numbers.
12.3 Then, Fix the Main Transaction Points
Review receiving, put-away, picking, packing, transfers, returns, adjustments, and production use. Consequently, stock changes will be captured where they happen.
12.4 After That, Add a Cycle Count Plan
Group items by value, speed, and error risk. Therefore, the team can count high-impact stock often without closing the full warehouse.
12.5 Improve Inventory Forecasting and Purchasing
Build reorder rules from demand, lead time, open supply, available stock, and safety stock. Moreover, require buyers to review excess and aging stock before raising new orders.
12.6 Finally, Create an Exception Dashboard
Show late purchase orders, low cover, negative stock, unusual adjustments, slow goods, forecast bias, and order failures. As a result, managers can act before the issue reaches the customer.
13. Frequently Asked Questions About Inventory Management Statistics
13.1 What Are the Most Important Inventory Management Statistics for 2026?
The most useful inventory management statistics cover ecommerce growth, manual inventory work, stock distortion, inventory accuracy, and operational KPIs. For example, U.S. ecommerce sales reached $326.7 billion in Q1 2026, while ecommerce represented 16.9% of total retail sales. Additionally, Shopify’s 2026 guide cites Gartner research showing that about one-third of buyers still use manual methods.
13.2 Why Do Inventory Management Statistics Matter?
Inventory management statistics help leaders compare risk, spot trends, and set priorities. However, the best use is not copying a broad benchmark. Instead, companies should connect the data to their own stockouts, excess stock, count errors, lead times, and cash needs.
13.3 What Is Inventory Accuracy?
Inventory accuracy measures how closely system records match physical stock. Therefore, a count is accurate only when the item, quantity, status, and location are correct.
13.4 What Is a Good Inventory Accuracy Rate?
A strong rate should be close to complete accuracy for key items and locations. Nevertheless, the right target depends on product value, order speed, warehouse design, and current process maturity.
13.5 How Often Should a Company Count Inventory?
The count rate should follow risk. For example, fast, costly, or error-prone items may need daily or weekly cycle counts. Meanwhile, stable low-value items may need less frequent checks.
13.6 What Is Inventory Distortion?
Inventory distortion is the gap between demand, the system record, and real stock. As a result, it appears through stockouts, excess stock, poor allocation, false availability, or lost items.
13.7 How Much Does Inventory Distortion Cost?
IHL Group estimated the global 2024 cost at $1.7 trillion, including $1.2 trillion from out-of-stocks and $554 billion from overstocks. Therefore, the problem affects both revenue and working capital.
13.8 Why Are Stockouts and Excess Stock Linked?
Both issues often come from weak forecasts, late updates, wrong counts, poor lead-time data, or bad location planning. Consequently, buying more stock may reduce one stockout while creating excess elsewhere.
13.9 What Is Inventory Turnover?
Inventory turnover shows how often average stock is sold and replaced. Therefore, it helps leaders judge stock speed and capital use.
13.10 Is Higher Inventory Turnover Always Better?
Not always. Although high turnover may show strong sales and lean stock, it may also mean the company holds too little stock to protect service.
13.11 What Is Days Inventory Outstanding?
Days inventory outstanding estimates how long stock stays in the business. Consequently, a rising number may point to slower sales or excess buying.
13.12 What Is Sell-Through Rate?
Sell-through compares units sold with units received. Therefore, it is useful for seasonal products, fashion, launches, and short buying windows.
13.13 How Does Ecommerce Growth Affect Inventory?
Ecommerce raises the need for fast stock updates, clear reservations, and accurate channel availability. Moreover, it can expose weak sync because customers see availability before warehouse staff review the order.
13.14 Why Do Businesses Still Use Spreadsheets?
Spreadsheets are cheap, flexible, and familiar. However, they become risky when several users, warehouses, channels, and systems must update the same stock record.
13.15 When Should a Business Replace Inventory Spreadsheets?
A company should review stronger tools when it faces repeated overselling, count gaps, late buying, slow finance close, multi-site stock, or heavy manual reconciliation. Therefore, the trigger is often growing process risk.
13.16 What Is Real-Time Inventory Visibility?
Real-time visibility means the system updates stock as orders, receipts, picks, transfers, returns, and adjustments occur. As a result, teams make choices from current data rather than delayed exports.
13.17 What Is Available-to-Promise Inventory?
Available-to-promise stock is the amount the business can safely commit after reservations, holds, and known supply rules are considered. Therefore, it is usually lower than total on-hand stock.
13.18 How Does a WMS Improve Inventory Accuracy?
A WMS guides and records warehouse work such as receiving, put-away, picking, transfers, and counts. Consequently, fewer stock moves depend on memory or later entry.
13.19 How Does ERP Improve Inventory Control?
ERP links inventory with purchasing, sales, accounting, production, and reports. Therefore, one stock move can update the wider business record without repeated manual entry.
13.20 How Can AI Help Inventory Planning?
AI can flag demand changes, stockout risk, excess cover, late orders, or unusual stock moves. However, its output still depends on clean data and clear business rules.
13.21 Can Shopify Manage All Inventory Needs?
Shopify can support commerce and inventory updates, especially for simpler operations. Nevertheless, growing brands may need deeper purchasing, WMS, EDI, accounting, production, and multi-channel control behind Shopify.
13.22 Which Industries Need the Strongest Inventory Control?
Apparel, furniture, food, wholesale, manufacturing, sporting goods, consumer products, and parts distribution often face high stock complexity. However, any company with many SKUs, sites, or channels can reach the same point.
13.23 How Can a Business Reduce Stockouts?
Start by checking accuracy, lead times, reservations, open supply, reorder rules, and forecast bias. Then, use exception alerts so the team can act before available stock reaches zero.
13.24 How Can a Business Reduce Excess Inventory?
Review stock age, weeks of cover, open purchase orders, supplier minimums, and sell-through. In addition, stop new buying when existing supply already covers realistic demand.
13.25 Which Inventory Report Should Management Review First?
Begin with an exception dashboard that shows low cover, excess stock, negative stock, late purchase orders, and high-value count gaps. As a result, leaders see the items that need action rather than reading a long stock list.
14. Turn Inventory Management Statistics Into Better Operations
Inventory management statistics make one point clear: product businesses cannot separate stock accuracy from growth. Although sales channels create demand, inventory, purchasing, warehouse, and finance teams must still fulfill that demand with one trusted record.
Therefore, the best 2026 plan is not simply to buy more software. First, clean the data. Next, control the stock moves. Then, connect purchasing, warehouse work, orders, and accounting. Finally, use forecasts and AI to improve decisions once the base data is reliable.
For companies that have outgrown spreadsheets, QuickBooks, inventory-only tools, or disconnected warehouse apps, Xorosoft provides a connected cloud ERP and WMS path for inventory-driven growth. Explore the platform, review the fit, and Book a Demo to see how inventory, accounting, purchasing, warehouse management, ecommerce, and reporting can work together.
Recent Posts
-
 Best AI Warehouse Management Software for ERP Inventory and Warehouse Operations
 -
 Project Based ERP Software for Managing Project Costs, Purchasing, Resources, Inventory, and Accounting
 -
 Food and Beverage ERP Requirements for Lot, Expiry, and Recall Control
 -
 How to Prevent EDI Errors Before They Become Retailer Chargebacks
 -
 Warehouse Injury and Safety Statistics: What Operations Teams Should Know Before Automating Workflows