If you’re seeking to improve your inventory management processes, understanding inventory control KPIs is essential.
1. Growing Inventory Operations Lose Visibility Before They Lose Stock
Inventory problems rarely begin with an empty warehouse. Instead, they usually start with delayed receiving, inaccurate allocations, disconnected systems, or purchasing decisions based on outdated reports.
As businesses add products, suppliers, warehouses, and sales channels, inventory becomes more difficult to control. For example, a report may show that an item is available even though the physical units are damaged, reserved, misplaced, or stored at another location.
Meanwhile, a second warehouse may hold excess quantities of the same product. Consequently, the business can experience stockouts and overstock at the same time.
As a result, inventory control KPIs help managers identify these operational gaps. More importantly, they show whether inventory records are accurate, products are available, stock moves efficiently, and purchasing decisions align with demand.
However, the value of each KPI depends on a consistent formula, reliable data, a clear owner, and a practical review schedule.
1.1 What Inventory Control KPIs Measure
Inventory control KPIs are measurable indicators that evaluate stock accuracy, product availability, inventory movement, cost, planning, and warehouse execution.
For example, common inventory control KPIs include:
- Inventory accuracy
- Stockout rate
- Inventory turnover
- Order fill rate
- Carrying cost
- Forecast accuracy
- Picking accuracy
- Dead stock percentage
However, a number becomes a useful KPI only when the company defines its purpose. Therefore, each measure should include a formula, target, reporting frequency, data source, and responsible owner.
1.2 Why Inventory Management KPIs Matter
Inventory influences cash flow, gross margin, customer service, purchasing, production planning, and financial reporting. As a result, weak inventory control can create problems across the entire company.
Too little inventory may lead to shortages, backorders, missed sales, and production delays. On the other hand, excessive stock may increase storage costs, insurance expenses, markdown exposure, and obsolescence risk.
Therefore, the objective is not simply to minimize inventory. Instead, a business should carry the right products, in the right quantities, at the right locations, and at the right time.
1.3 Who Needs a Formal Inventory KPI Framework?
In addition, a structured inventory KPI framework becomes especially valuable when a company:
- Manages hundreds or thousands of SKUs
- Operates multiple warehouses
- Sells through ecommerce and wholesale channels
- Experiences frequent inventory adjustments
- Manages seasonal or perishable products
- Manufactures finished goods
- Depends on long supplier lead times
- Uses third-party logistics providers
- Has significant working capital invested in stock
A smaller company may not require all 25 inventory control KPIs immediately. Nevertheless, it should usually begin with inventory accuracy, stockout rate, turnover, inventory aging, and order fill rate.
2. How Inventory Control KPIs Create a Reliable Measurement Framework
Tracking every available metric can produce more reports without improving decisions. Therefore, businesses should select inventory control KPIs according to the questions management needs to answer.
2.1 Six Categories of Inventory Control Metrics
| KPI category | Business question | Example KPIs |
|---|---|---|
| Accuracy | Can the company trust its stock records? | Inventory accuracy, cycle count accuracy |
| Availability | Can customer demand be fulfilled? | Stockout rate, fill rate, backorder rate |
| Velocity | How efficiently does inventory move? | Turnover, DIO, sell-through |
| Cost | How much cash and margin does inventory consume? | Carrying cost, GMROI |
| Planning | Are purchasing and forecasts aligned with demand? | Forecast accuracy, supplier lead time |
| Execution | How effectively does the warehouse handle stock? | Picking accuracy, dock-to-stock time |
In practice, this structure prevents teams from focusing only on inventory value. Moreover, it connects operational activity with customer service and financial performance.
2.2 Leading and Lagging Inventory Performance Metrics
Lagging indicators describe results that have already occurred. For instance, inventory turnover, carrying cost, and dead stock percentage show the outcome of earlier purchasing and planning decisions.
Leading indicators, however, reveal conditions that may create future problems. Supplier lead-time variability, forecast bias, purchase-order delays, and falling cycle count accuracy may warn managers before stockouts or excess inventory become severe.
As a result, an effective dashboard should include both leading and lagging inventory performance metrics.
2.3 Why Universal Inventory Benchmarks Can Mislead
A strong inventory turnover rate for one industry may be unsuitable for another. Because food, apparel, furniture, industrial components, and replacement parts have different product lifecycles, they also require different performance targets.
Therefore, companies should compare inventory control KPIs against:
- Historical company performance
- Product-category targets
- Warehouse-level results
- Customer-service requirements
- Seasonal demand patterns
- Financial objectives
- Relevant peer benchmarks
In many cases, steady improvement against a reliable internal baseline is more useful than an unsupported industry average.
3. Inventory Control KPIs for Accuracy and Data Integrity
Because inventory accuracy supports reliable purchasing, fulfillment, forecasting, and accounting, it should be one of the first KPIs a business reviews. When stock records are incorrect, every department works with unreliable information.
3.1 Inventory Accuracy KPI
In simple terms, inventory accuracy measures how closely system records match verified physical inventory.
Formula:
Inventory accuracy = Accurate inventory records ÷ Total inventory records checked × 100
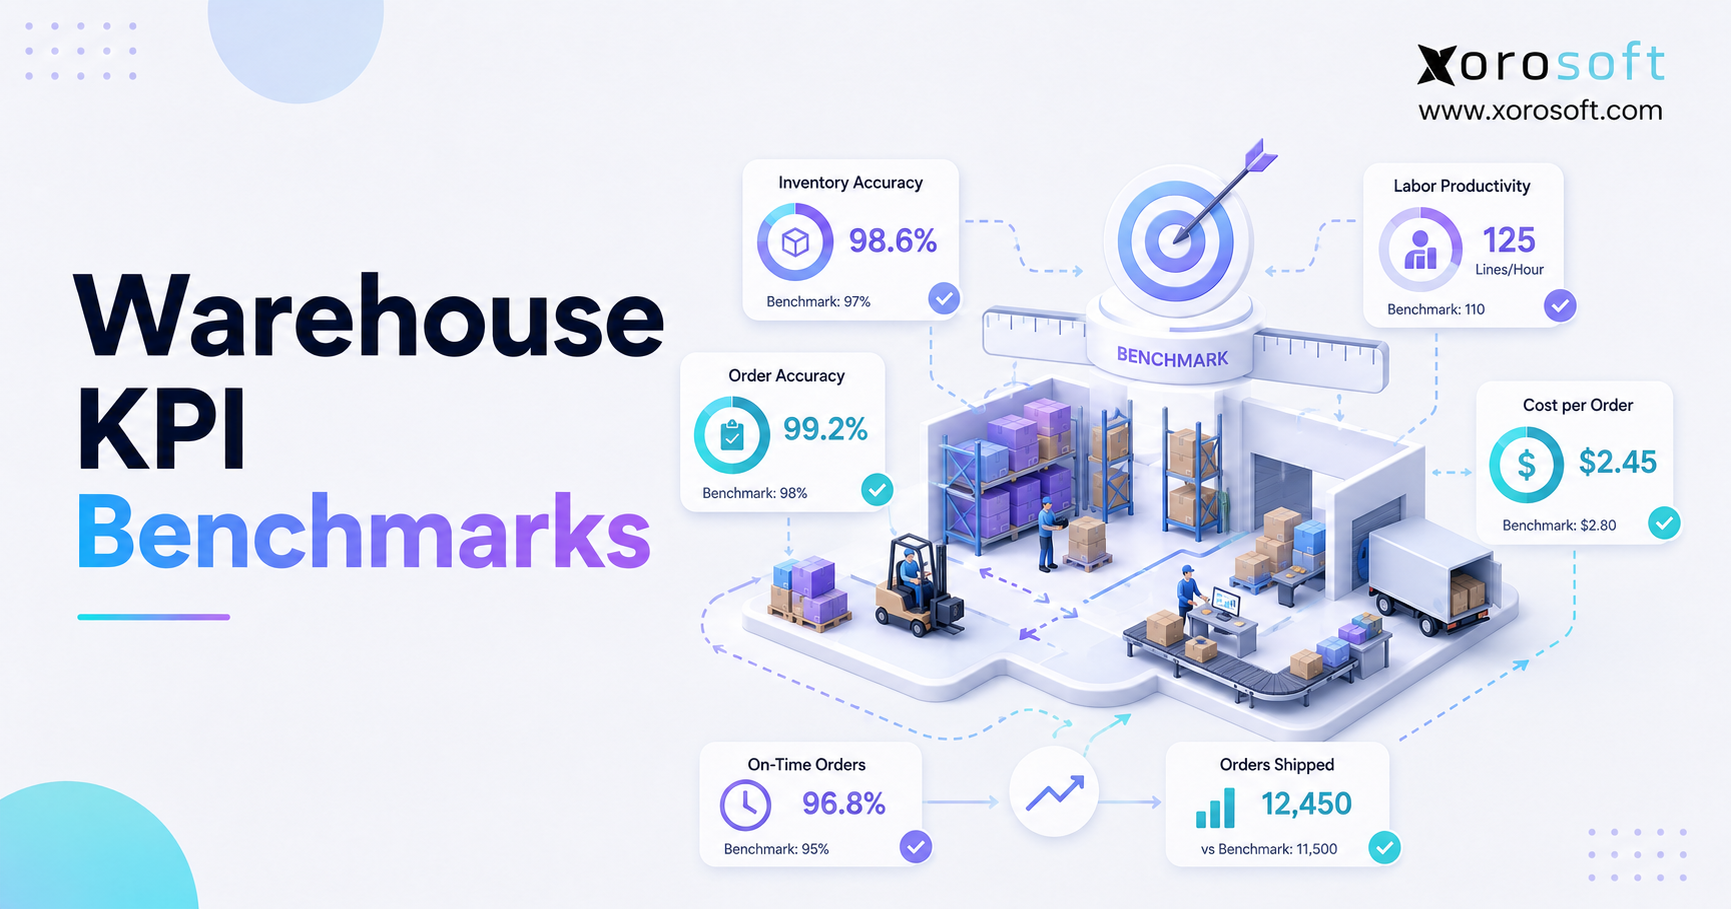
For example, a cycle count reviews 1,000 SKU-location records. If 970 records match within the approved tolerance, inventory accuracy equals 97%.
However, the company must first define what an accurate record means. Some businesses require an exact unit match, while others use a quantity or financial-value tolerance.
For example, common causes of low inventory accuracy include:
- Receiving errors
- Incorrect product identification
- Unrecorded inventory movements
- Picking mistakes
- Delayed transaction updates
- Returns placed in the wrong status
- Incorrect units of measure
- Uncontrolled adjustments
- Duplicate product records
- Poor bin-location discipline
Therefore, teams should investigate the transaction that created each variance instead of simply posting another adjustment.
3.2 Cycle Count Accuracy
In addition, cycle count accuracy measures how many recurring inventory counts match system records.
Formula:
Cycle count accuracy = Accurate count lines ÷ Total count lines × 100
Unlike a full annual physical count, cycle counting reviews selected inventory throughout the year. Consequently, high-value and fast-moving products can be counted more frequently than low-risk items.
For instance, an ABC cycle-counting program may classify products as:
- A items: high-value, high-risk, or fast-moving inventory
- B items: moderate-value or moderate-activity inventory
- C items: lower-value or slower-moving inventory
Although cycle counting helps identify discrepancies, it should not become a routine adjustment exercise. Instead, every significant variance should lead to root-cause analysis.
3.3 Inventory Shrinkage Rate
Inventory shrinkage measures stock that should exist according to system records but cannot be physically accounted for.
Formula:
Inventory shrinkage rate = Inventory loss value ÷ Recorded inventory value × 100
Shrinkage may result from theft. However, it can also result from damage, receiving mistakes, incorrect quantities, unrecorded consumption, or administrative errors.
Therefore, managers should analyze shrinkage by product, warehouse, transaction type, and adjustment reason.
3.4 Inventory Adjustment Rate
Inventory adjustment rate measures how frequently employees correct inventory quantities or values.
Formula:
Inventory adjustment rate = Adjusted inventory units or value ÷ Total inventory handled × 100
Adjustments are sometimes necessary. Nevertheless, a rising adjustment rate may indicate that an upstream process is failing.
For example, repeated corrections may reveal:
- Incorrect receiving procedures
- Poor picking controls
- Transfer errors
- Returns-processing gaps
- Manufacturing consumption mistakes
- Delayed transaction entry
Instead of treating adjustments as the solution, teams should identify why the corrections were required.
4. Product Availability KPIs That Protect Customer Service
In addition, availability metrics show whether a business can fulfill customer demand without unnecessary delays, substitutions, or backorders. Although these measures are related, each one highlights a different operational risk.
4.1 Stockout Rate
In simple terms, stockout rate measures how often requested inventory is unavailable.
Formula:
Stockout rate = Stockout events ÷ Total demand opportunities × 100
The denominator must remain consistent. For instance, a company may measure stockouts by:
- Order line
- Customer request
- SKU-location-day
- Replenishment event
- Sales opportunity
In addition, stockout rate should be reviewed alongside inventory turnover. Otherwise, a company may appear to improve efficiency while actually carrying insufficient stock.
4.2 Order Fill Rate
Order fill rate measures the percentage of customer orders fulfilled completely from available inventory.
Formula:
Order fill rate = Orders filled completely ÷ Total orders × 100
Suppose a company receives 1,000 orders and ships 920 without shortages. In that case, its order fill rate equals 92%.
As a result, this KPI provides a strict customer-level view of inventory availability because one missing line can make the entire order incomplete.
4.3 Line Fill Rate
Line fill rate measures the percentage of individual order lines fulfilled completely.
Formula:
Line fill rate = Complete order lines ÷ Total order lines × 100
For example, an order contains 10 lines and nine ship completely. Therefore, the line fill rate is 90%, while the order fill rate for that order is 0%.
Businesses should often track both measures. Order fill rate shows complete-order performance, whereas line fill rate shows item-level availability.
4.4 Backorder Rate
Backorder rate measures how much demand cannot be fulfilled at the expected time.
Formula:
Backorder rate = Backordered orders, lines, or units ÷ Total orders, lines, or units × 100
For example, a rising backorder rate may indicate:
- Poor demand forecasting
- Supplier delays
- Inaccurate reorder points
- Inventory allocation problems
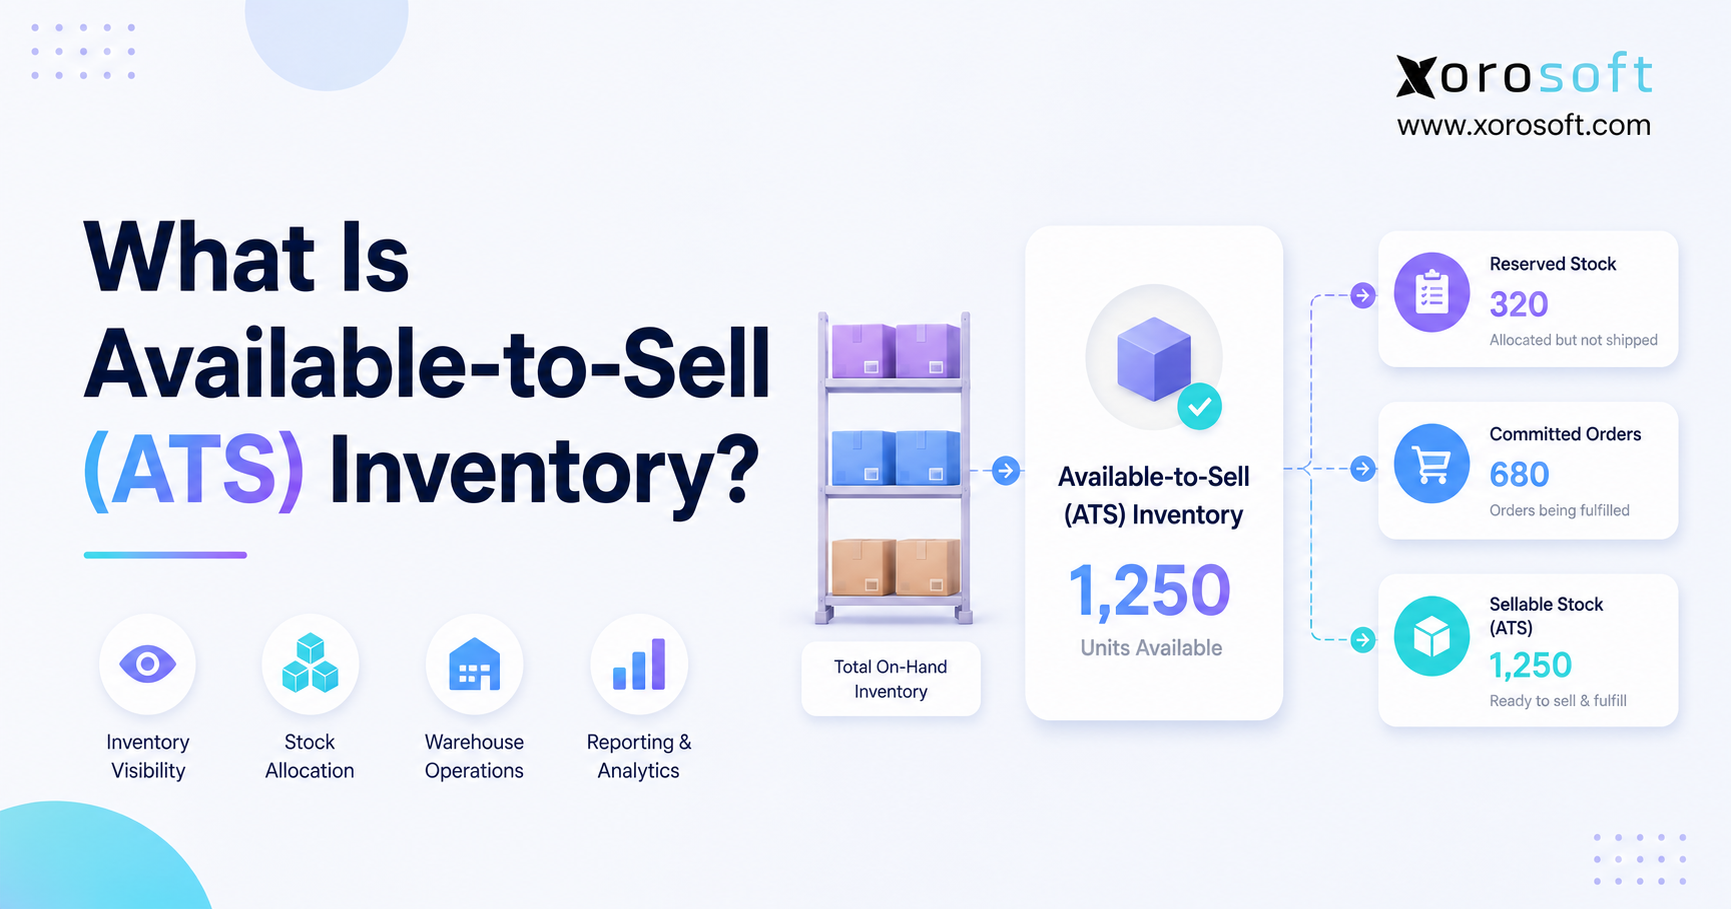
- Incorrect available-to-promise quantities
- Purchasing approval delays
Moreover, backorders should be segmented by customer, SKU, warehouse, and root cause.
5. Flow and Velocity KPIs for Better Inventory Management
Meanwhile, flow and velocity metrics show how efficiently stock moves through the business. However, faster inventory movement is not automatically better when it creates shortages or emergency purchasing.
5.1 Inventory Turnover Ratio
In practical terms, inventory turnover measures how many times average inventory is sold or consumed during a reporting period.
Formula:
Inventory turnover = Cost of goods sold ÷ Average inventory
For example, annual cost of goods sold equals $6 million, while average inventory equals $1.5 million.
Inventory turnover = $6 million ÷ $1.5 million = 4
Therefore, the company turns its average inventory four times per year.
Higher turnover may indicate efficient stock use. Nevertheless, if stockouts and expedited purchases rise at the same time, the business may be carrying insufficient inventory.
5.2 Days Inventory Outstanding
Days inventory outstanding converts inventory investment into a number of days.
Formula:
DIO = Average inventory ÷ Cost of goods sold × Number of days
For instance:
Average inventory = $1 million
Annual cost of goods sold = $5 million
DIO = $1 million ÷ $5 million × 365
DIO = 73 days
Overall, inventory turnover and DIO describe a similar relationship. Turnover expresses frequency, whereas DIO expresses duration.
5.3 Sell-Through Rate
Similarly, sell-through rate measures the percentage of available units sold during a period.
Formula:
Sell-through rate = Units sold ÷ Units available for sale × 100
For example, this KPI is especially useful for:
- Seasonal collections
- Apparel
- Product launches
- Consumer goods
- Sporting goods
- Short-lifecycle inventory
For better analysis, businesses should calculate sell-through by product, category, channel, collection, and location.
5.4 Inventory Aging
Inventory aging groups stock according to how long it has remained unsold or unused.
Common aging ranges include:
- 0–30 days
- 31–60 days
- 61–90 days
- 91–180 days
- More than 180 days
However, the correct ranges depend on the product lifecycle. For example, a 120-day-old replacement part may remain productive, while a seasonal fashion item of the same age may already require a markdown.
Therefore, an inventory aging report should include product category, historical demand, seasonality, and future commitments.
5.5 Dead Stock Percentage
Dead stock refers to inventory with little realistic expectation of future sale or operational use.
Formula:
Dead stock percentage = Dead stock value ÷ Total inventory value × 100
Before calculating this KPI, however, the company should define dead stock using:
- Last-sale date
- Forecast demand
- Product status
- Product lifecycle
- Customer commitments
- Production requirements
- Disposal or return options
Without a formal definition, different teams may classify the same inventory differently.
6. Cost and Profitability Inventory Control KPIs
Inventory is an operational asset, but it also consumes cash. Consequently, cost and profitability inventory control KPIs help finance and operations teams evaluate whether inventory investment produces an acceptable return.
6.1 Inventory Carrying Cost
Inventory carrying cost measures the total cost of holding stock over time.
For example, it may include:
- Warehouse space
- Insurance
- Handling labor
- Technology
- Damage
- Shrinkage
- Obsolescence
- Taxes
- Cost of capital
Formula:
Inventory carrying cost percentage = Annual carrying costs ÷ Average inventory value × 100
Businesses should use their actual cost structure. Otherwise, a generic percentage from an unrelated industry may create misleading targets.
6.2 Gross Margin Return on Inventory Investment
GMROI measures how much gross margin a business earns for each monetary unit invested in average inventory.
Formula:
GMROI = Gross margin ÷ Average inventory cost
For example, $2 million in gross margin divided by $1 million in average inventory cost produces a GMROI of 2.0.
Thus, the company generates two dollars of gross margin for every dollar invested in average inventory.
Still, GMROI should be reviewed with turnover and sell-through. In some cases, a high-margin item may produce a strong return even when it moves more slowly.
6.3 Inventory-to-Sales Ratio
Meanwhile, inventory-to-sales ratio compares inventory value with sales value.
Formula:
Inventory-to-sales ratio = Inventory value ÷ Sales value
A rising ratio may indicate that inventory is growing faster than sales. However, seasonal purchasing, planned expansion, or a product launch can also increase the ratio temporarily.
As a result, trend analysis and business context remain essential.
6.4 Working Capital Invested in Inventory
Inventory converts cash into products that may not generate revenue immediately. Therefore, purchasing decisions directly affect liquidity.
In addition, a working-capital review should examine:
- Current inventory value
- Open purchase orders
- Supplier payment terms
- Inventory aging
- Expected demand
- Customer deposits
- Backorders
- Planned promotions
Inventory value alone can be misleading. For instance, a business may reduce total inventory while increasing the proportion of slow-moving products.
7. Forecasting and Purchasing Inventory Control KPIs
Forecasting and purchasing metrics show whether replenishment decisions align with actual demand. Because inaccurate forecasts affect both stockouts and excess inventory, these inventory control KPIs require regular review.
7.1 Inventory Forecast Accuracy
Forecast accuracy compares expected demand with actual demand.
For example, common methods include:
- Mean absolute percentage error
- Weighted absolute percentage error
- Mean absolute error
- Root mean square error
MAPE calculates average percentage error by period. However, it may become unreliable when actual demand is zero or very low.
WAPE, by comparison, divides total absolute error by total actual demand. Therefore, it may be more practical across a broad product portfolio.
Whichever method a business chooses, it should document the formula and apply it consistently. Moreover, teams should calculate accuracy at the level where planning decisions occur.
7.2 Forecast Bias
In addition, forecast bias identifies whether forecasts consistently overstate or understate demand.
A forecast may appear reasonably accurate in aggregate while still containing systematic bias. For example, repeated over-forecasting may create excess stock, whereas repeated under-forecasting may increase shortages.
Consequently, forecast accuracy and forecast bias should be reviewed together.
7.3 Supplier Lead Time
Supplier lead time measures the elapsed period between placing a purchase order and receiving usable inventory.
Formula:
Supplier lead time = Inventory availability date − Purchase-order date
Average lead time provides one perspective. Nevertheless, lead-time variability may matter more when calculating safety stock.
For instance, a supplier that usually delivers in 20 days but occasionally takes 45 days creates more risk than one that consistently delivers in 24 days.
7.4 Supplier Fill Rate
Supplier fill rate measures how much of the ordered quantity a supplier delivers as requested.
Formula:
Supplier fill rate = Units received as requested ÷ Units ordered × 100
However, the business should define “received as requested” before comparing supplier performance. Depending on its operating model, the definition may include:
- Correct quantity
- Correct delivery date
- Acceptable quality
- Correct packaging
- Complete documentation
7.5 Purchase-Order Cycle Time
Purchase-order cycle time measures the time required to convert an approved purchase request into a transmitted purchase order.
For example, long cycle times may result from:
- Manual approvals
- Spreadsheet-based purchasing
- Missing supplier data
- Unclear reorder rules
- Duplicate data entry
- Delayed budget approval
Therefore, teams should measure both approval time and execution time.
For Shopify businesses, inventory requirements often expand beyond storefront tracking. As order volumes grow, teams may need to connect Shopify with purchasing, accounting, forecasting, and warehouse workflows.
In this context, the Xorosoft ERP Shopify app provides an example of an ERP layer designed to support broader operational processes behind Shopify.
8. Warehouse Inventory KPIs That Influence Stock Accuracy
Warehouse performance directly affects inventory records. Therefore, receiving, putaway, picking, and shipping measurements should form part of the wider inventory control framework.
8.1 Picking Accuracy
Picking accuracy measures the percentage of picks completed without product or quantity errors.
Formula:
Picking accuracy = Correct picks ÷ Total picks × 100
As a result, picking mistakes create two problems at once. First, the customer receives the wrong product. Second, the inventory system may record a different item leaving the warehouse.
In addition, for deeper analysis, review picking accuracy by:
- Picker
- Shift
- Zone
- Order type
- Product category
- Picking method
A warehouse management system can support controlled receiving, inventory movements, picking, and warehouse-level visibility. However, process discipline and location accuracy remain equally important.
8.2 Dock-to-Stock Cycle Time
Dock-to-stock time measures the period between delivery arrival and inventory availability.
Formula:
Dock-to-stock time = Putaway completion time − Delivery arrival time
As a result, long dock-to-stock times can create apparent stockouts. Although goods are physically present, they may not yet be inspected, recorded, labeled, or available for allocation.
8.3 Order Cycle Time
Order cycle time measures the elapsed period from order receipt to shipment or delivery.
Therefore, businesses should distinguish between:
- Order-entry time
- Allocation time
- Pick-and-pack time
- Shipment processing time
- Carrier transit time
- Total customer order cycle time
As a result, each team can be held accountable for the part of the process it controls.
9. Reading Inventory Control KPIs Together
A single KPI rarely explains the complete problem. Instead, managers should evaluate related inventory control KPIs as a group.
| KPI result | Related KPI | Possible interpretation |
| Turnover rises | Stockout rate also rises | Inventory may have been reduced too aggressively |
| Accuracy declines | Adjustment rate increases | Transaction controls may be failing |
| Forecast accuracy improves | Dead stock remains high | Existing obsolete inventory still needs action |
| Fill rate declines | Supplier lead time increases | Replenishment settings may be outdated |
| Carrying cost falls | Backorders increase | Cost reduction may be harming service |
| GMROI rises | Sell-through falls | High margin may be masking slow movement |
9.1 Combined Inventory KPI Example
Suppose a wholesaler improves inventory turnover from four to five turns per year. Initially, the result appears positive.
However, stockout rate also increases, order fill rate declines, expedited purchases rise, and customer backorders grow. Therefore, the company has not necessarily improved inventory control.
Instead, it may have reduced stock without improving forecasting, purchasing, or supplier performance.
A connected operating platform such as XoroONE can bring inventory, purchasing, warehouse, and financial information into one reporting environment. As a result, teams can investigate causes rather than comparing disconnected reports.
10. Inventory Control KPI Reporting Cadence and Ownership
Reporting frequency should match the decision cycle. For example, a monthly stockout report is too slow for daily replenishment decisions.
On the other hand, calculating full inventory carrying cost every day may add little practical value.
10.1 Daily Inventory Control KPIs
For example, daily reviews should focus on:
- Stockouts
- Backorders
- Inventory adjustments
- Picking errors
- Receiving delays
- Unallocated customer orders
These measures allow operational teams to address immediate exceptions before they affect additional orders.
10.2 Weekly Inventory Management KPIs
Similarly, weekly reviews should include:
- Order fill rate
- Line fill rate
- Cycle count accuracy
- Supplier fill rate
- Purchase-order cycle time
- Sell-through rate
Weekly reporting provides enough information to reveal developing trends. At the same time, it allows teams to take corrective action before the end of the month.
10.3 Monthly Inventory Performance Metrics
Meanwhile, monthly reviews should cover:
- Inventory turnover
- Days inventory outstanding
- Carrying cost
- Forecast accuracy
- GMROI
- Inventory aging
- Inventory-to-sales ratio
Consequently, finance, operations, purchasing, and senior management can evaluate both operational and financial performance.
10.4 Quarterly Inventory Strategy Reviews
Finally, quarterly reviews should evaluate:
- Dead stock
- Working-capital allocation
- Supplier strategy
- Inventory policies
- Safety-stock assumptions
- KPI targets
- System limitations
Moreover, each KPI should have one accountable owner even when several departments contribute to the result.
11. Inventory Control KPIs by Industry and Business Model
Different industries face different inventory risks. Therefore, inventory control KPIs should reflect product characteristics, customer expectations, and operational complexity.
11.1 Inventory KPIs for Shopify and Ecommerce Businesses
For example, ecommerce companies should prioritize:
- Channel inventory accuracy
- Stockout rate by channel
- Sell-through rate
- Order allocation accuracy
- Cancellation rate caused by unavailable stock
- Returns awaiting disposition
- Order cycle time
As ecommerce operations grow, the main challenge often shifts from storefront visibility to coordination across purchasing, warehouses, accounting, and multiple sales channels.
11.2 Inventory KPIs for Wholesale Distributors
Similarly, wholesale distributors should focus on:
- Order fill rate
- Line fill rate
- Backorder rate
- Customer-specific service levels
- Supplier fill rate
- Inventory allocation
- EDI order accuracy
- Inventory aging
Moreover, results should be segmented by customer type because company-wide averages may hide service problems for strategic accounts.
11.3 Inventory KPIs for Manufacturing Companies
Meanwhile, manufacturers should add:
- Raw-material availability
- Work-in-progress aging
- Material-shortage frequency
- BOM accuracy
- Production inventory accuracy
- Component turnover
- Supplier lead-time variability
These measures should connect with purchasing, work orders, production planning, and material consumption.
11.4 Inventory KPIs for Apparel and Fashion
In particular, apparel businesses often manage size and color variants, seasonal collections, short product lifecycles, markdown exposure, and high return volumes.
Therefore, sell-through, inventory aging, variant accuracy, and stockout rate deserve special attention.
11.5 Inventory KPIs for Furniture Businesses
Furniture businesses may prioritize:
- Long-lead-time inventory
- Damage rate
- Special-order stock
- Inventory value by location
- Supplier lead-time reliability
- Customer-order cycle time
Because individual units may carry high financial values, both quantity accuracy and value accuracy matter.
11.6 Inventory KPIs for Sporting Goods Businesses
Sporting-goods businesses frequently manage seasonal products, kits, bundles, and multi-channel demand.
Useful inventory control KPIs include:
- Seasonal sell-through
- Bundle availability
- Product lifecycle performance
- Channel stockouts
- Forecast accuracy
- Inventory aging
The Xorosoft industries overview explains how inventory-driven companies across apparel, wholesale, furniture, sporting goods, food, and manufacturing require different operational workflows.
11.7 Inventory KPIs for Food and Beverage Businesses
Similarly, food and beverage companies should also monitor:
- Expiration exposure
- Lot accuracy
- Waste percentage
- Shelf-life remaining
- Recall traceability
- First-expired, first-out compliance
These measures depend on accurate lot, date, status, and warehouse-location records.
11.8 Multi-Warehouse Inventory Control KPIs
Multi-warehouse businesses should compare:
- Inventory accuracy by warehouse
- Regional stockout rate
- Inter-warehouse transfer time
- Inventory imbalance by location
- Picking accuracy by site
- Dock-to-stock performance
A company may have sufficient inventory overall. However, it can still experience shortages when stock is located in the wrong region.
12. Creating an Inventory Control KPI Dashboard
Inventory control KPIs become more useful when a dashboard highlights exceptions that require decisions. Therefore, it should not display every available number simply because the data exists.
12.1 Essential Inventory KPI Dashboard Elements
At minimum, every KPI should show:
- Current result
- Target
- Previous-period result
- Historical trend
- Alert threshold
- Responsible owner
- Reporting period
- Data source
- Drill-down options
- Corrective action
In addition, the dashboard should display the refresh time for each data source.
12.2 Inventory Dashboard Filters
In addition, users should be able to analyze results by:
- SKU
- Product category
- Supplier
- Customer
- Warehouse
- Location
- Sales channel
- Brand
- Buyer
- Reporting period
Company-wide averages often hide product-level and warehouse-level problems. Consequently, drill-down capability is essential.
12.3 Operational and Executive Inventory Dashboards
For example, operational dashboards should emphasize:
- Current stockouts
- Open backorders
- Picking errors
- Receiving delays
- Inventory adjustments
Executive dashboards, however, should emphasize:
- Inventory turnover
- Working capital
- Carrying cost
- GMROI
- Customer-service levels
- Forecast performance
Although the audiences differ, both dashboards should use the same KPI definitions. Otherwise, managers and operational teams may discuss different versions of the same result.
13. Data Quality Determines Inventory KPI Reliability
However, a sophisticated dashboard cannot compensate for incomplete or inaccurate transactions.
Reliable inventory control KPIs depend on accurate:
- Sales orders
- Purchase orders
- Receipts
- Transfers
- Returns
- Cycle counts
- Adjustments
- Work orders
- Product records
- Accounting transactions
Disconnected applications often require employees to export, clean, and combine information manually. During that process, reporting periods, product identifiers, and units of measure may become inconsistent.
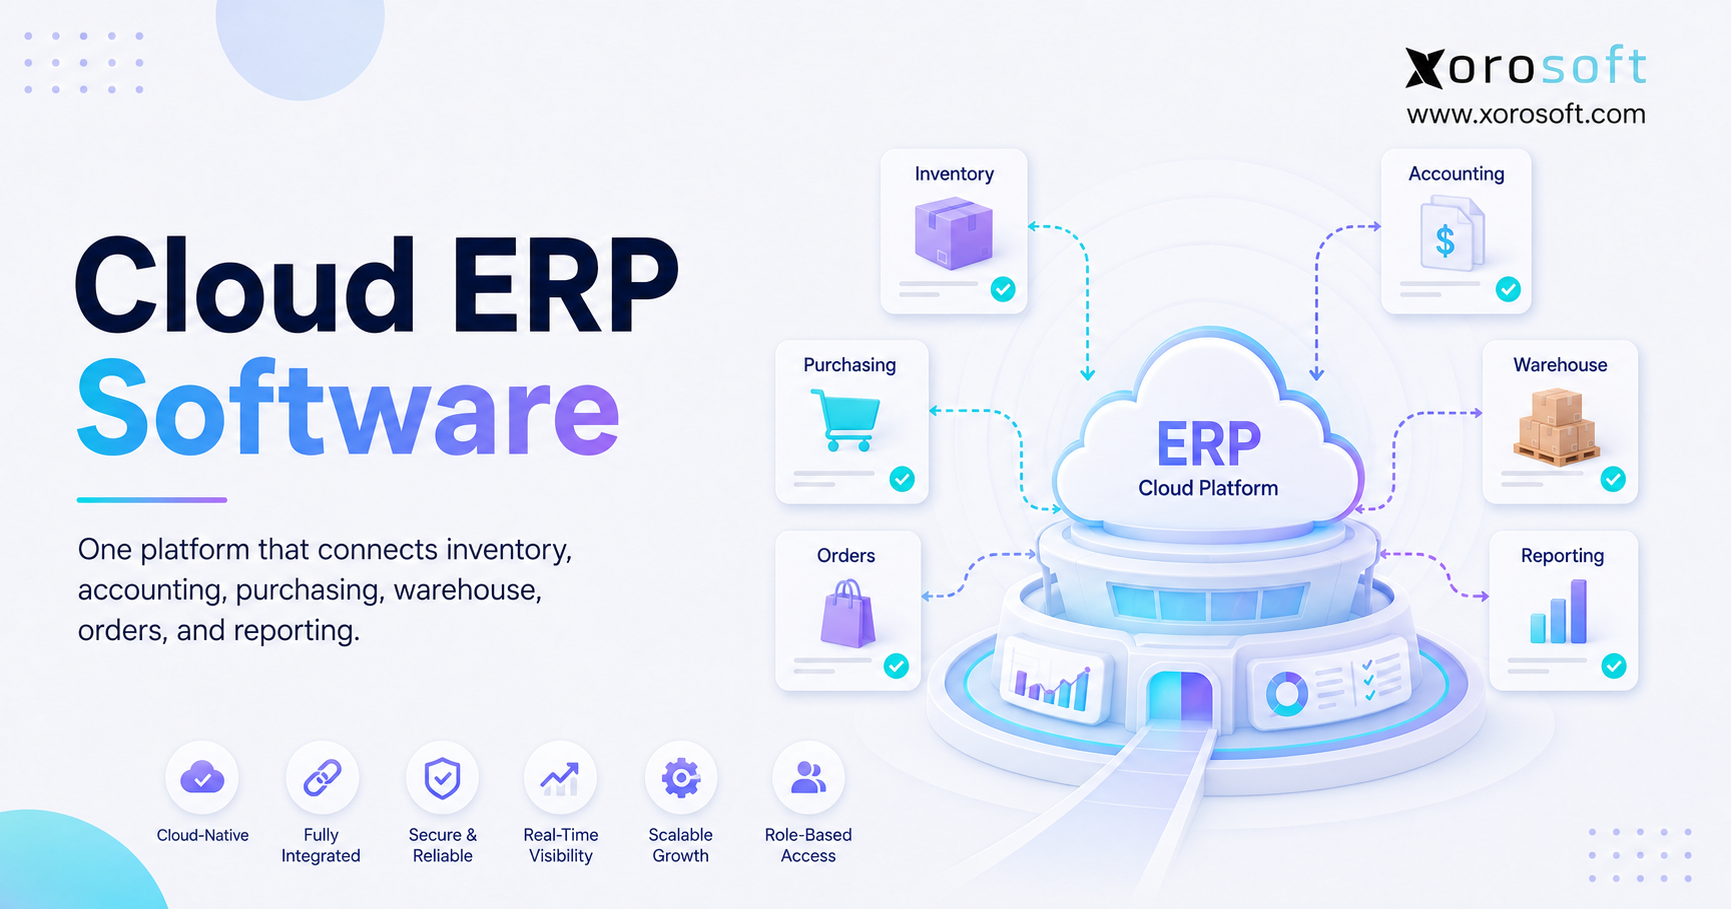
An integrated cloud ERP for inventory-driven businesses can connect inventory, accounting, purchasing, forecasting, manufacturing, and reporting.
Nevertheless, software alone does not create reliable inventory control KPIs. Item governance, transaction discipline, and clearly assigned ownership remain necessary.
14. Common Inventory Control KPI Mistakes That Distort Decisions
Even well-designed inventory control KPIs can become misleading when teams use inconsistent definitions or review them without context.
14.1 Tracking Too Many Inventory Metrics
A dashboard with 50 indicators often receives less attention than one with eight carefully selected KPIs.
Therefore, businesses should begin with measures connected to their most important risks.
14.2 Using Inconsistent KPI Formulas
Fill rate may be calculated by orders, lines, units, or value. Because each approach answers a different question, the company should document the chosen method and avoid changing it between reporting periods.
14.3 Treating Every Product the Same
Fast-moving products, replacement parts, seasonal goods, and high-value items require different targets and review frequencies.
Instead of applying one company-wide benchmark, businesses should segment inventory control KPIs by product characteristics.
14.4 Ignoring Inventory Data Delays
A dashboard may appear real time while receiving delayed updates from warehouses, marketplaces, or logistics providers.
Consequently, users should know when each data source was last refreshed.
14.5 Reporting KPIs Without Owners
Most importantly, every KPI needs one accountable owner. Shared interest is valuable; however, shared accountability can leave corrective actions unfinished.
14.6 Measuring Performance Without Taking Action
A KPI creates value only when it changes a decision. Therefore, each alert threshold should connect to a defined investigation or corrective action.
15. When Inventory Software Is No Longer Enough
Different systems solve different operational problems. Therefore, businesses should evaluate spreadsheets, inventory software, warehouse management systems, and ERP platforms according to their actual requirements.
15.1 When Spreadsheets May Still Work
For example, spreadsheets may remain practical when a company has:
- A small number of SKUs
- One warehouse
- Low transaction volume
- Simple purchasing
- No manufacturing
- Limited reporting requirements
However, manual files become risky when several employees update inventory independently.
15.2 When a Warehouse Management System Becomes Relevant
A warehouse management system becomes useful when warehouse execution is the main challenge.
For instance, common signs include:
- Complex bin-level tracking
- High picking volume
- Barcode-scanning requirements
- Directed putaway
- Frequent fulfillment errors
- Multiple warehouse zones
- Detailed warehouse labor tracking
15.3 When an ERP Platform Becomes Relevant
ERP becomes relevant when inventory issues are connected to accounting, purchasing, forecasting, manufacturing, ecommerce, and wholesale operations.
For example, a business may need ERP when it:
- Operates multiple warehouses
- Uses QuickBooks with several inventory apps
- Manages Shopify, Amazon, wholesale, or EDI orders
- Requires integrated inventory valuation
- Manufactures products
- Needs purchasing automation
- Struggles with duplicate data entry
When evaluating options, companies should compare implementation requirements, total cost, integrations, industry fit, and reporting flexibility.
The Xorosoft versus NetSuite comparison offers a practical starting point for businesses evaluating modern ERP alternatives.
16. A Practical Inventory Control KPI Implementation Plan
A successful KPI program does not begin with dashboard design. Instead, inventory control KPIs should begin with a clearly defined business problem and a measurable operational objective.
16.1 Define the Inventory Objective
First, start with one priority, such as:
- Improving inventory accuracy
- Reducing stockouts
- Releasing cash from aging inventory
- Improving supplier performance
- Reducing warehouse errors
Then, connect that objective to a measurable business result.
16.2 Select Five to Eight Priority KPIs
Next, choose a balanced group across accuracy, availability, velocity, cost, and planning.
For example, a starting set may include:
- Inventory accuracy
- Stockout rate
- Order fill rate
- Inventory turnover
- Inventory aging
- Forecast accuracy
- Supplier lead time
- Picking accuracy
16.3 Document Every KPI Formula
Specify:
- Numerator
- Denominator
- Reporting period
- Exclusions
- Tolerances
- Unit of measure
- Data source
As a result, teams will be less likely to create competing versions of the same KPI.
16.4 Validate the Inventory Data
Before setting targets, reconcile system information with physical counts and accounting records.
Otherwise, the business may establish goals using an unreliable baseline.
16.5 Assign KPI Owners
After that, name one accountable person for every KPI. In addition, identify the departments that must support corrective action.
16.6 Establish Current Baselines
Then, measure performance across several representative periods. Avoid using an unusual peak season or one-time disruption as the only baseline.
16.7 Set Targets and Alert Thresholds
Targets should reflect:
- Product characteristics
- Customer commitments
- Supplier reliability
- Warehouse capabilities
- Financial objectives
- Seasonal demand
Therefore, one target should not automatically apply to every SKU or warehouse.
16.8 Connect Inventory KPIs to Corrective Actions
Finally, every KPI should trigger an appropriate response.
For instance:
- Low accuracy may trigger a cycle-count review
- High stockouts may trigger replenishment analysis
- Rising aging may trigger markdown or transfer decisions
- Poor supplier fill rate may trigger a vendor review
- High adjustment rates may trigger a process audit
17. Frequently Asked Questions About Inventory Control KPIs
17.1 What Are Inventory Control KPIs?
Inventory control KPIs are measurements used to evaluate stock accuracy, availability, movement, cost, planning, and warehouse execution. For example, common measures include inventory accuracy, stockout rate, turnover, fill rate, carrying cost, and forecast accuracy. Therefore, a metric becomes a KPI only when it has a target, owner, reporting schedule, and business purpose.
17.2 What Are the Most Important Inventory Management KPIs?
The most broadly useful inventory management KPIs include inventory accuracy, stockout rate, order fill rate, turnover, DIO, carrying cost, forecast accuracy, and inventory aging. However, priorities depend on the company’s industry, product lifecycle, warehouse structure, and service requirements. As a result, every business should select KPIs based on its own operational risks.
17.3 How Do You Measure Inventory Control Performance?
Businesses should combine record accuracy, availability, inventory velocity, carrying cost, supplier performance, forecasting, and warehouse execution. Therefore, no single KPI should be used to judge the entire inventory operation. Instead, managers should review related KPIs together so they can understand the real cause of performance issues.
17.4 What Is the Inventory Accuracy KPI?
Inventory accuracy measures how closely system records match verified physical stock. Before measuring it, the company should decide whether an exact match or an approved tolerance will apply. In addition, teams should review the value and cause of each variance, not just the final accuracy percentage.
17.5 How Is Inventory Accuracy Calculated?
Inventory accuracy is calculated by dividing accurate inventory records by total records checked and multiplying the result by 100. For example, if 970 of 1,000 records match the approved tolerance, inventory accuracy equals 97%. However, the formula is useful only when the company applies the same counting rules consistently.
17.6 What Is a Good Inventory Accuracy Percentage?
There is no universal percentage for every business. Instead, the target should reflect product value, transaction volume, regulation, customer commitments, and counting methodology. Therefore, companies should create a reliable baseline first and then improve accuracy by SKU, warehouse, and product category.
17.7 What Is the Inventory Turnover Ratio?
Inventory turnover measures how many times average stock is sold or consumed during a reporting period. However, the result should always be reviewed alongside stockouts, margins, and customer-service levels. Otherwise, a business may mistake low inventory levels for operational efficiency.
17.8 How Do You Calculate Inventory Turnover?
Inventory turnover is calculated by dividing cost of goods sold by average inventory value. When inventory fluctuates significantly, use several monthly balances so the average is more representative. As a result, the KPI gives a more accurate view of inventory movement over time.
17.9 Is Higher Inventory Turnover Always Better?
No. Higher turnover may indicate efficiency, but it may also indicate insufficient stock. Consequently, managers should review turnover alongside backorders, stockouts, and expedited purchasing before deciding whether the result is positive.
17.10 What Is Inventory Carrying Cost?
Inventory carrying cost is the total cost of holding stock. It may include warehouse space, insurance, labor, technology, damage, shrinkage, obsolescence, taxes, and capital costs. Therefore, businesses should calculate this KPI using their own actual costs instead of relying on a generic industry percentage.
17.11 How Do You Calculate Inventory Carrying Cost?
First, add the annual costs associated with storing, financing, handling, and risking inventory. Next, divide that amount by average inventory value and multiply the result by 100. Finally, document which cost categories are included so the calculation remains consistent over time.
17.12 What Is the Stockout Rate?
Stockout rate measures how often an item is unavailable when demand occurs. However, the denominator must remain consistent across reporting periods. For example, a company may measure stockouts by order line, customer request, SKU-location-day, or sales opportunity.
17.13 What Is the Difference Between Stockout Rate and Fill Rate?
Stockout rate measures unavailable demand, whereas fill rate measures fulfilled demand. Although they are related, they are not always exact opposites because companies may use different denominators. Therefore, businesses should define both formulas clearly before comparing the results.
17.14 What Is Days Inventory Outstanding?
Days inventory outstanding estimates how many days inventory remains on hand before sale or consumption. The formula divides average inventory by cost of goods sold and multiplies the result by the number of days. As a result, DIO helps finance and operations teams understand how long cash remains tied up in stock.
17.15 What Is the Difference Between DIO and Inventory Turnover?
Both metrics describe inventory velocity. However, turnover shows frequency, while DIO expresses the same relationship in days. Therefore, finance teams often use DIO for working-capital analysis, whereas operations teams may prefer turnover for product and category reviews.
17.16 What Is Cycle Count Accuracy?
Cycle count accuracy measures the percentage of recurring counts that match system records within an approved tolerance. As a result, companies can monitor selected inventory throughout the year. In addition, frequent cycle counts help identify transaction issues before they become larger inventory discrepancies.
17.17 How Do You Measure Inventory Shrinkage?
Inventory shrinkage is measured by dividing unaccounted inventory value by recorded inventory value. In addition, teams should investigate damage, theft, receiving errors, incorrect quantities, and unrecorded consumption. Otherwise, the business may know the loss percentage without understanding the root cause.
17.18 What Is Dead Stock Percentage?
Dead stock percentage measures the share of inventory value with little realistic expectation of future sale or operational use. Therefore, the business needs a formal dead-stock definition before calculating the result. For example, the definition may include last-sale date, forecast demand, product status, and disposal options.
17.19 How Do Businesses Measure Forecast Accuracy?
Common forecast accuracy methods include MAPE, WAPE, MAE, and RMSE. Moreover, forecast bias should be reviewed to identify repeated over-forecasting or under-forecasting. As a result, teams can understand not only how wrong the forecast was, but also whether the error follows a repeated pattern.
17.20 How Often Should Inventory KPIs Be Reviewed?
Operational measures may require daily review, while supplier and fill-rate metrics often suit weekly reviews. Meanwhile, turnover, carrying cost, forecast accuracy, and aging usually support monthly analysis. Therefore, the review schedule should match how quickly the business can act on the result.
17.21 Which Inventory KPIs Should Ecommerce Businesses Track?
Ecommerce businesses should track inventory accuracy, stockouts, sell-through, allocation accuracy, order cycle time, returns awaiting disposition, and channel availability. In addition, multi-channel sellers should monitor synchronization delays and overselling risk. As a result, they can reduce fulfillment issues across Shopify, marketplaces, and warehouses.
17.22 Which Inventory KPIs Should Wholesalers Track?
Wholesalers should prioritize order fill rate, line fill rate, backorders, supplier lead time, inventory allocation, aging, and turnover. Moreover, results should be segmented by customer type. Otherwise, company-wide averages may hide poor service levels for strategic accounts.
17.23 Which Inventory KPIs Should Manufacturers Track?
Manufacturers should measure raw-material availability, WIP aging, material shortages, production accuracy, supplier lead time, forecast performance, and component turnover. In addition, these metrics should connect with BOMs, purchasing, work orders, and production plans. Therefore, inventory control becomes part of the production planning process, not only a warehouse activity.
17.24 Can ERP Software Track Inventory KPIs Automatically?
ERP software can automate many calculations when inventory, purchasing, accounting, warehouse, and sales transactions share consistent data. Nevertheless, clean product records, controlled transactions, documented formulas, and KPI ownership remain essential. Therefore, automation works best when strong processes already support the data.
17.25 When Should a Business Upgrade Its Inventory System?
A company should consider upgrading when it experiences frequent discrepancies, spreadsheet dependency, disconnected accounting, multi-warehouse complexity, delayed reporting, or stockouts despite excess inventory. However, the decision should follow a clear operational requirement rather than a desire for more features. In many cases, the real issue is disconnected data rather than the KPI formula itself.
18. Turn Inventory KPI Visibility Into Better Operational Decisions
Inventory control KPIs create value when they help teams identify causes, assign ownership, and take corrective action. Therefore, businesses should begin with five to eight measures tied to their most important operational and financial risks.
First, validate the source data. Next, document every formula and assign an owner. Then, review results by product, warehouse, supplier, and sales channel rather than relying only on company-wide averages.
As operational complexity increases, inventory reporting should connect with purchasing, warehouse management, accounting, ecommerce, and manufacturing. However, a system upgrade should occur only when disconnected tools prevent teams from obtaining consistent and timely information.
Businesses evaluating a connected ERP platform can contact Xorosoft to review their inventory processes, reporting requirements, warehouse structure, and system-readiness priorities.