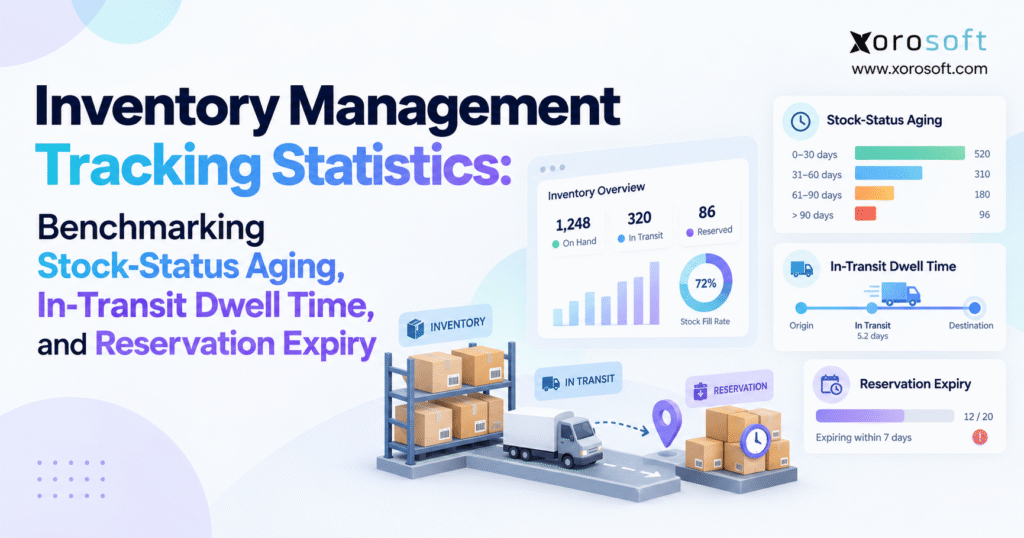
If you’re looking to improve your business operations, understanding inventory management tracking statistics is essential.
1. Accurate Inventory Can Still Be Operationally Unavailable
Inventory accuracy is usually treated as the foundation of inventory control. That is reasonable because a wrong system balance affects nearly every downstream process. If software shows 1,000 units while the warehouse physically holds 920, purchasing may reorder too late, sales may promise units that do not exist, and finance may carry an incorrect inventory balance.
Yet accurate quantities do not guarantee healthy inventory flow.
A company can have a correct inventory balance while hundreds of units remain stuck in receiving, held by an expired reservation, delayed between warehouses, or blocked by an unresolved quality status. In these situations, the inventory record may technically be accurate, but the stock still cannot support demand.
This is where inventory management tracking statistics become more useful than quantity reporting alone. They help operations teams measure not only how much inventory exists but also how long it remains in each operational condition.
1.1 Inventory Accuracy and Inventory Flow Answer Different Questions
Accuracy tells a business whether physical stock and system stock agree. Inventory flow, by contrast, shows whether stock is progressing through the operation at the expected speed.
Consider 400 units shipped from Warehouse A to Warehouse B. System records may correctly show all 400 units as in transit. However, the normal transfer takes one day, and those units have remained in transit for six days.
From a quantity perspective, the record is accurate. Operationally, something needs investigation.
The same distinction appears in order reservations. Software may correctly reserve 50 units for a customer order. If the order is cancelled but the reservation remains active, those units can disappear from sellable availability despite sitting physically in the warehouse.
1.2 Time Adds the Missing Dimension to Inventory Visibility
Reliable inventory control requires four connected dimensions: quantity, location, status, and time.
Quantity shows how many units exist. Location identifies where they are. A status explains what the business can currently do with those units, while elapsed time shows how long that condition has persisted.
Once time becomes part of the inventory model, managers can identify exceptions before they develop into larger availability, fulfillment, or reconciliation problems.
Rather than building another dashboard full of disconnected KPIs, the objective should be to identify inventory that should have moved, changed status, been released, or become available but did not.
2. What Inventory Management Tracking Statistics Actually Measure
Inventory management tracking statistics measure inventory movement, availability, status, location, and elapsed time between operational events.
These measures extend traditional inventory KPIs by tracking the operational lifecycle of stock. Instead of asking only how much inventory exists or what it is worth, teams can analyze how efficiently inventory progresses through purchasing, receiving, storage, allocation, transfer, fulfillment, returns, and reconciliation.
2.1 Quantity, Location, Status, and Time Form the Core Tracking Model
Every inventory record should answer four practical questions: how many units are involved, where those units are located, what operational status they currently hold, and how long that status has existed.
These dimensions become increasingly important as businesses expand across warehouses and sales channels.
For example, inventory may physically exist at a location while remaining unavailable because it is reserved, damaged, undergoing inspection, or already allocated to another order. An on-hand quantity alone cannot explain those differences well enough for operational decision-making.
2.2 Inventory Events Create the Data Behind Inventory Tracking Metrics
Reliable inventory management tracking statistics depend on meaningful transactional events.
A purchase receipt creates an event. Transfer shipment, warehouse receipt, reservation, allocation, pick confirmation, return, adjustment, and inventory-status changes create additional events.
Each event should include a timestamp and enough transaction context to explain what occurred.
With that operational history, teams can answer more useful questions. How long did receiving take? Was inventory reserved longer than expected? Which transfer lanes regularly exceed their planned duration? How quickly does returned stock become sellable again?
Without reliable event history, managers are left with current balances but little explanation of how inventory reached its present condition.
3. Stock-Status Aging Reveals Inventory That Is Not Progressing
Stock-status aging measures how long inventory remains in a specific operational condition.
This differs from traditional inventory aging. Traditional aging commonly measures the time since goods were purchased or received, while status aging measures how long inventory remains inside a workflow state.
That distinction matters because recently purchased inventory can still become operationally stuck.
3.1 How to Calculate Inventory Status Aging
The basic formula is:
Stock-Status Age = Current Time − Status Entry Time
When inventory has already left the status, use:
Time in Status = Status Exit Time − Status Entry Time
Suppose a pallet enters inspection at 9:00 a.m. Monday and becomes available at 3:00 p.m. Tuesday. The pallet spent 30 hours in inspection.
That duration can then be compared with the normal inspection cycle for the warehouse, product category, supplier, or receiving team.
3.2 Available Inventory Aging Needs a Different Interpretation
Available inventory can also be aged, but its meaning differs from short-cycle operational status aging.
Long available age may indicate slow-moving products, excess purchasing, weak demand forecasting, seasonal exposure, or assortment problems. Those issues matter, but they should not be measured with the same thresholds used for receiving or reservations.
Inventory remaining available for 120 days may be commercially concerning while still being operationally valid. By comparison, stock remaining in receiving for three days may demand immediate attention.
Effective benchmarks therefore reflect what each inventory status actually represents.
3.3 Receiving and Inspection Aging Expose Inbound Bottlenecks
Receiving queues directly influence inventory availability.
A purchase order may arrive physically while the system continues to show the goods as incoming or unavailable. When receiving, inspection, labeling, or putaway is delayed, that inventory cannot support demand even though it is already inside the facility.
Tracking receiving age helps separate supplier lead time from internal warehouse delay.
Managers can compare receipt-to-availability time by warehouse, supplier, SKU class, product type, shipment size, or day of week. That analysis can expose whether the bottleneck comes from staffing, scheduling, inspection requirements, labeling work, data entry, or warehouse layout.
3.4 Quarantine and Damaged Inventory Need Aging Controls
Stock in quarantine, quality hold, or damaged status can easily disappear from normal operational attention because it sits outside regular picking activity.
Unresolved blocked inventory still ties up working capital and may influence purchasing decisions.
When teams do not know whether quarantined inventory normally remains unresolved for one day or three weeks, they cannot distinguish ordinary quality processing from neglected exceptions.
Aging reports should therefore make the oldest blocked records visible along with quantity, value, reason, location, and responsible owner.
4. In-Transit Dwell Time Measures the Health of Warehouse Transfers
In-transit inventory is stock that has left one inventory point but has not completed receipt at the destination.
This can include warehouse transfers, store replenishment, movements to production sites, transfers to third-party fulfillment facilities, or other internal inventory movements.
Simply counting in-transit units is not enough. Operations teams also need to know how long those units have remained between locations.
4.1 How to Calculate In-Transit Dwell Time
For completed transfers:
In-Transit Dwell Time = Destination Receipt Time − Origin Shipment Time
For an open transfer:
Open Transit Age = Current Time − Origin Shipment Time
The resulting duration should then be compared with the expected transit window for that specific route.
A two-day transfer may be normal across a large geographic network. The same duration could be a serious exception between nearby warehouses.
4.2 Planned Versus Actual Transit Time Creates a Better Benchmark
Raw dwell time becomes much more useful when measured against expected performance.
Use:
Transit Variance = Actual Transit Time − Planned Transit Time
This approach creates more realistic warehouse-transfer benchmarks because it respects differences between routes.
Rather than stating that every transfer must complete within 24 hours, a business can define expected duration by transfer lane and monitor how often actual movements exceed that target.
Median transit time and 90th-percentile transit time deserve attention as well. An average alone can conceal a small group of extremely old transfers.
4.3 Open Transfers Often Indicate More Than Transportation Delay
An aged transfer does not automatically mean the carrier caused the problem.
Physical delivery may already have occurred while destination receiving remains incomplete. In other cases, only part of a transfer was received, the origin posted shipment confirmation too early, or an integration failed to transmit the receiving transaction.
Because several causes are possible, aged transfers should become exceptions for investigation rather than automatic logistics failures.
Useful reporting allows a manager to move directly from the aging statistic into the transaction history that created it.
5. Reservation Aging Shows When Inventory Is Committed Without Moving
Inventory reservations protect stock for expected demand.
That control prevents different orders from consuming the same units. At the same time, reservation logic can create hidden shortages when stock remains committed longer than the underlying demand requires.
Reservation aging measures how long that commitment remains open.
5.1 How to Calculate Reservation Age
Use:
Reservation Age = Current Time − Reservation Creation Time
For meaningful analysis, segment reservations by type.
A temporary ecommerce checkout reservation may need a short timeout. Confirmed wholesale allocations can legitimately remain open much longer, while production reservations may operate under an entirely different workflow.
Applying one universal reservation threshold across all demand sources usually produces misleading exceptions.
5.2 Reservation Expiry Measures Stale Inventory Commitments
Reservation expiry occurs when a commitment reaches a defined time or business condition and should be released, reviewed, or converted into another status.
A useful KPI is:
Reservation Expiry Rate = Expired Reservations ÷ Total Reservations × 100
This percentage needs context.
High expiry can result from abandoned orders, failed payments, cancellations, inappropriate timeout rules, integration delays, or slow order processing.
Rather than trying to eliminate every expired reservation, teams should understand why reservations expire and whether released stock returns to availability promptly.
5.3 Reserved, Allocated, and Available Inventory Need Clear Definitions
Organizations often use inventory-status terminology differently.
For reporting purposes, the business should define precisely when stock moves from available to reserved, when a reservation becomes an allocation, and when allocated inventory enters warehouse execution.
Those definitions should stay consistent across ecommerce, ERP, WMS, reporting, and finance.
Otherwise, one system may consider inventory available while another already treats the same quantity as committed. Conflicting definitions can make inventory management tracking statistics appear unreliable even when each application is technically following its configured rules.
6. Inventory Management Tracking Statistics That Deserve Regular Review
Not every inventory metric belongs on an executive dashboard.
The most useful inventory management tracking statistics are usually those that reveal whether stock is progressing through expected processes at the expected speed.
6.1 Average Status Age and Median Status Age
Average status age gives a broad picture of process duration, while the median describes typical performance more clearly when extreme values exist.
Consider ten receiving transactions completed in 2, 2, 3, 3, 3, 4, 4, 5, 6, and 30 hours.
A single 30-hour exception pushes the average upward. Meanwhile, the median continues to represent the normal workflow more closely.
Using both measurements gives managers a better view of overall exposure and routine process performance.
6.2 90th-Percentile Inventory Age Finds the Long Tail
The 90th percentile is particularly useful for inventory operations because it exposes the slower end of a process.
In practical terms, it answers: How long does the slowest 10% of this process take?
Teams can apply this metric to receiving, warehouse transfers, reservation duration, return processing, quarantine resolution, and other inventory-status transitions.
When the median stays stable while the 90th percentile rises, routine operations may still be healthy while exception management is deteriorating.
6.3 Aged-Status Percentage Shows the Size of the Problem
Another useful measure is the percentage of records that exceed an accepted threshold.
Businesses can calculate the result using transaction count, unit quantity, or inventory value.
Value-based analysis becomes especially useful when a small number of high-value items create greater financial exposure than hundreds of inexpensive units.
Looking at all three views helps operations and finance understand whether an exception is operationally frequent, quantitatively large, or financially significant.
6.4 Availability Recovery Time Tracks How Fast Blocked Stock Returns
Availability recovery time measures how long stock takes to return to a usable or sellable condition after a temporary block.
The metric can apply to returns, inspection holds, payment failures, cancelled reservations, quality checks, or transfer discrepancies.
Faster recovery reduces the amount of physically present inventory that cannot serve new demand.
7. Benchmarking Inventory Management Tracking Statistics Without Inventing Industry Averages
Businesses naturally look for external benchmarks. However, inventory management tracking statistics such as reservation duration, internal transfer time, and receiving dwell are highly dependent on operating model.
Universal thresholds can therefore be misleading.
A stronger approach establishes an internal baseline first and then compares performance across periods, locations, product groups, channels, and process types.
7.1 Establish a Reliable Internal Baseline
Begin with several weeks or months of clean transaction history.
Calculate average, median, 75th-percentile, and 90th-percentile performance for important inventory processes. After that baseline is established, segment the results according to operational context.
For example, Warehouse A may typically receive inventory within six hours, while Warehouse B takes 18 hours. That difference does not automatically mean one location is underperforming.
Before drawing a conclusion, compare product types, volumes, operating schedules, inspection requirements, and staffing models.
7.2 Use Relative Thresholds Where Fixed Targets Do Not Work
One practical approach classifies performance relative to the expected process duration.
Activity within the planned cycle time can be treated as healthy. Slight delays can enter a watch state, while more significant deviations become at-risk transactions. Records materially beyond expected duration should move into an exception workflow.
Relative thresholds adapt more effectively to transfer lanes, product categories, warehouses, and customer processes than a single fixed number.
7.3 Benchmark Improvement, Not Just Absolute Performance
The most useful question is often whether the operation is getting better.
If 90th-percentile transfer dwell decreases every month, the business is reducing long-tail exceptions even when its absolute performance cannot be compared fairly with another company.
Internal trend lines are therefore often more actionable than broad industry averages.
8. Multi-Warehouse Inventory Metrics Need Location-Level Context
Multi-warehouse businesses require more than a consolidated inventory balance.
A company may have sufficient total stock across its network while the wrong items remain concentrated in the wrong facilities.
Under these conditions, inventory management tracking statistics should be evaluated at both network and warehouse levels.
8.1 Transfer Aging Should Be Measured by Lane
Every warehouse pair creates a transfer lane.
For each major lane, measure planned transit duration, actual dwell time, late-transfer percentage, partial-receipt frequency, and exception-resolution time.
That level of detail makes recurring network problems easier to identify.
Suppose transfers from Warehouse A to Warehouse C normally arrive on schedule, while A-to-B transfers repeatedly exceed their expected duration. Managers can then investigate transportation, receiving capacity, transfer scheduling, or transaction processing specific to that lane.
8.2 Warehouse Comparisons Need Process Normalization
Location comparisons become misleading when operating models differ significantly.
A high-volume ecommerce fulfillment center, wholesale distribution warehouse, and bulk-storage facility may have very different receiving, picking, transfer, and inspection requirements.
Performance benchmarks should therefore compare similar processes wherever possible instead of treating every facility as operationally identical.
8.3 Location-Level Visibility Helps Reduce Unnecessary Replenishment
Poor transfer visibility can encourage teams to purchase more stock instead of using inventory already moving through the network.
Better location and status visibility helps distinguish genuine replenishment requirements from temporary availability gaps caused by transfers, receiving delays, or existing reservations.
That distinction becomes especially important when working capital is constrained or lead times are long.
9. Shopify Inventory Tracking Requires More Than Channel-Level Stock Counts
Shopify businesses often begin with relatively straightforward inventory processes.
Complexity increases as brands add multiple warehouses, wholesale orders, marketplaces, purchasing teams, returns, EDI, or manufacturing.
At that stage, channel-level stock becomes only one component of the overall inventory picture.
9.1 Ecommerce Availability Depends on Upstream Inventory Events
An ecommerce storefront needs a dependable answer to a simple question: how much can be sold right now?
Behind that number sit multiple operational events.
Purchase orders need to be received before incoming stock becomes usable. Warehouse transfers must reach their destinations. Returned goods may require inspection. Wholesale demand can hold units through allocations, while marketplaces may consume stock shared with direct-to-consumer channels.
Disconnected systems make those dependencies harder to trace.
9.2 Shopify Inventory Should Be Reconciled With Operational Inventory
For a growing Shopify operation, inventory tracking metrics should explain why units move between on-hand, committed, unavailable, and sellable conditions.
Businesses researching deeper ERP connectivity can review the Xorosoft ERP app for Shopify as one example of connecting ecommerce activity with broader operational workflows.
Synchronization by itself is not enough.
Teams should be able to trace the transaction that caused inventory to become committed, unavailable, transferred, received, released, or adjusted.
10. Inventory Tracking Benchmarks Change by Industry and Business Model
Inventory is not managed the same way across every industry.
A benchmark suitable for apparel may be inappropriate for furniture. Food operations must account for lots and expiration dates. Manufacturers need raw-material and work-in-process visibility, while wholesale distributors frequently manage customer-specific allocations and larger commitments.
Businesses should therefore align tracking metrics with their actual operating model.
Organizations across inventory-driven industries may need the same basic dimensions—quantity, location, status, and time—but their thresholds and operational priorities can differ considerably.
10.1 Apparel and Fashion
Apparel businesses frequently manage style, color, size, season, and channel complexity.
Products may remain technically sellable while losing commercial value as seasons progress.
For that reason, apparel teams should analyze traditional inventory age alongside reservation duration, transfer delays, channel allocation, and sell-through patterns.
10.2 Furniture and Large-Item Distribution
Furniture operations can involve longer receiving, inspection, staging, and delivery workflows.
Managers need to distinguish legitimate dwell created by handling requirements from preventable delay caused by incomplete transactions, scheduling gaps, or capacity constraints.
Large products also occupy significant warehouse space, so stalled inventory may create a physical capacity problem before it creates an accounting problem.
10.3 Food and Beverage
Food businesses should interpret status aging alongside lot, batch, shelf-life, and expiration information.
A quality hold involving short-dated goods can have a much larger commercial impact than an equivalent delay affecting durable inventory.
Timeliness therefore needs to be evaluated in relation to the remaining usable life of the product.
10.4 Manufacturing
Manufacturing introduces raw materials, production reservations, work in process, finished goods, and material holds.
Teams may need to measure how long components wait before production, how long materials remain committed to inactive work orders, and how quickly finished goods become available after production completion.
11. ERP and WMS Architecture Determines the Quality of Inventory Management Tracking Statistics
Reliable inventory management tracking statistics require reliable transactions.
A dashboard cannot fully reconstruct missing warehouse events or inconsistent timestamps after the fact.
ERP and WMS architecture therefore matters when a business wants to measure inventory status consistently across departments and locations.
11.1 WMS Events Capture Physical Warehouse Activity
Warehouse management systems capture activities such as receiving, putaway, replenishment, movement, picking, packing, counting, and transfer processing.
Barcode scanning allows many of these events to be recorded closer to the physical action itself.
For companies that require more structured warehouse execution, XoroWMS is one example of a platform designed around warehouse transactions and inventory movement.
The value of these events extends well beyond task execution. Consistent timestamps make it possible to calculate receiving dwell, picking latency, transfer age, and related warehouse performance measures.
11.2 ERP Provides the Commercial and Financial Context
Warehouse execution represents only one part of the inventory lifecycle.
Purchasing determines expected supply. Sales orders create demand and commitments. Manufacturing consumes components and produces finished goods. Accounting records the value and financial implications of inventory changes.
An integrated platform such as XoroONE can connect these activities so inventory history does not have to be reconstructed across independent spreadsheets and point applications.
The objective is not application consolidation for its own sake. Greater value comes from maintaining consistent transactional context across operational and financial processes.
12. Inventory Data Quality Matters More Than Dashboard Design
Organizations frequently focus first on how inventory dashboards should look.
Sophisticated visualizations cannot compensate for inconsistent inventory definitions or missing events.
Before building advanced inventory management tracking statistics, teams should decide precisely what each status means and which transaction begins or ends that state.
12.1 Status Definitions Need One Operational Dictionary
Terms such as reserved, allocated, committed, unavailable, staged, picked, and in transit can have different meanings between systems.
Create an official operational definition for every important status.
For each one, document the entry event, exit event, source system, responsible team, and expected duration.
Consistent definitions prevent departments from producing different answers to the same inventory question.
12.2 Integration Latency Can Distort Inventory Tracking
A warehouse might complete an inventory transaction at 2:00 p.m., while another application receives the update 20 minutes later.
When reporting relies on integration timestamps instead of actual operational timestamps, calculated dwell times can become misleading.
Businesses should therefore understand how their system integrations exchange inventory information between ecommerce platforms, marketplaces, warehouse applications, EDI, accounting systems, and ERP.
12.3 Inventory Adjustments Should Not Replace Root-Cause Analysis
An inventory adjustment can correct a balance without explaining why the discrepancy occurred.
Frequent adjustments may hide receiving errors, picking mistakes, transfer issues, damage, or synchronization failures.
Track adjustment frequency and reason codes, but connect recurring adjustments to the operational workflow that generated them.
Fixing the balance is necessary. Preventing the next discrepancy creates the larger operational benefit.
13. Common Inventory Tracking Mistakes That Make Statistics Misleading
Poorly designed metrics can create false confidence.
A company may maintain numerous reports while still struggling to answer straightforward inventory questions.
13.1 Using Only Average Inventory Dwell Time
Averages can conceal extreme exceptions.
Pair average dwell with median values, percentile measures, and threshold counts.
If most transfers complete within one day but several remain open for weeks, leadership needs visibility into the exceptional records rather than reassurance from a reasonable-looking average.
13.2 Using the Same Threshold for Every Inventory Process
Receiving, reservations, transfers, returns, quarantine, and slow-moving stock operate on very different time scales.
A traditional 30-day inventory-aging bucket should not automatically become the standard for operational status aging.
An ecommerce reservation might become stale in hours. Warehouse transfers may take one or several days, while slow-moving finished goods could require months before aging becomes commercially significant.
Thresholds should reflect the process being measured.
13.3 Measuring KPIs Without Assigning Operational Ownership
Every meaningful exception needs an owner.
Receiving backlogs may belong to warehouse operations. Transit exceptions might involve logistics. Reservation expiry often requires order-operations review, while quarantine aging may belong to quality control.
Without ownership, an inventory metric remains descriptive rather than operational.
13.4 Closing Transactions Only to Improve the Dashboard
Old transfers, reservations, and holds should not be closed merely because they make a report look unhealthy.
Managers need to identify the underlying cause first.
Otherwise, teams may repeatedly remove symptoms from reports while the process continues creating identical exceptions.
14. Growing Businesses Should Upgrade When Inventory Questions Require Manual Investigation
Companies do not need advanced ERP simply because they reach a particular revenue level.
Operational complexity is the more useful trigger.
When everyday inventory questions require spreadsheet exports, warehouse messages, multiple applications, and manual reconciliation, the existing architecture may no longer fit the business.
14.1 Warning Signs of an Inventory Control Gap
A company should review its systems when teams cannot reliably determine why stock is unavailable or where an internal transfer stopped.
Other signals include warehouse transfers that routinely require manual follow-up, ecommerce availability that differs from warehouse availability, frequent adjustments, delayed month-end reconciliation, separate purchasing spreadsheets, and inconsistent inventory definitions.
At this stage, organizations may evaluate broader platforms such as XoroERP alongside other ERP options appropriate for their industry and operating complexity.
14.2 Evaluate Capabilities Instead of Choosing Software by Brand Alone
ERP selection should begin with workflows rather than software labels.
Ask whether the platform preserves inventory-status history. Determine whether users can trace transfer shipment and receipt events. Review reservation logic, warehouse scanning, adjustment controls, and financial reconciliation.
Companies evaluating larger systems may also find a Xorosoft and NetSuite comparison useful when researching different ERP approaches.
Software should ultimately be selected against documented business requirements rather than a generic ranking.
15. Xorosoft Fits Where Inventory, Warehousing, Purchasing, and Finance Need One Operating View
Xorosoft is positioned for inventory-driven businesses that need to connect inventory management with purchasing, warehouse operations, accounting, manufacturing, forecasting, ecommerce, and wholesale workflows.
This type of architecture becomes relevant when inventory management tracking statistics depend on events crossing several departments.
For example, a transfer changes inventory availability at two locations. Purchase receipts affect incoming stock and financial records. Reservations influence sellable quantities and order fulfillment. Warehouse adjustments may create accounting implications.
Connected transaction history makes those processes easier to investigate.
15.1 Unified Inventory Visibility Can Reduce Reconciliation Work
One reason companies lose confidence in inventory reporting is that different applications become responsible for separate parts of the same workflow.
An ecommerce platform may hold one availability figure, while warehouse software records another operational state. Accounting receives adjustments later, and purchasing maintains expected inventory separately.
Xorosoft’s broader ERP and operational solutions are designed for businesses trying to bring those workflows into a more connected environment.
The desired outcome is not simply fewer applications. Clearer transaction ownership and more reliable inventory history matter more.
15.2 Real Operational Examples Matter More Than Feature Lists
When evaluating any inventory platform, ask the vendor to demonstrate realistic exceptions rather than only ideal transactions.
Request an overdue transfer. Examine an expired reservation. Review a partial receipt, damaged inventory hold, or return that must become sellable again. Then trace how warehouse activity connects with inventory availability and accounting.
Published Xorosoft case studies can provide additional context for companies researching ERP changes.
A demonstration becomes much more valuable when it follows operational problems that resemble the company’s real environment.
16. Build an Inventory Tracking Framework Before Building More Reports
A practical implementation should begin with a limited number of important inventory states and expand only after teams can manage those states consistently.
16.1 Define the Inventory States That Affect Availability
Start with states that materially prevent inventory from supporting demand.
For many businesses, relevant conditions include incoming, receiving, available, reserved, allocated, in transit, quarantine, damaged, and return pending.
Document each status precisely so warehouse, ecommerce, finance, and operations teams interpret it consistently.
16.2 Identify the Entry and Exit Event for Every State
Every time-based metric requires dependable start and end events.
For receiving, the start could be physical arrival or receipt initiation. Completion might mean receipt posting, inspection clearance, or putaway.
Transfer tracking creates similar decisions. Transit could begin when the transfer is created, when picking finishes, when shipment is confirmed, or when a carrier physically collects the goods.
Consistency is more important than selecting a theoretically perfect timestamp and applying it inconsistently.
16.3 Establish the Initial Inventory Tracking Baseline
Collect historical data before imposing aggressive performance targets.
Calculate normal cycle time by workflow, then segment results by warehouse, SKU class, channel, customer type, transfer lane, or other relevant dimensions.
This baseline becomes the reference point for future improvement.
It also helps teams identify where exceptions are structural rather than isolated incidents.
16.4 Create Warning and Exception Rules
Not every aged transaction deserves immediate escalation.
A useful framework separates normal activity from watch conditions, at-risk records, and true exceptions.
Each level should have an associated action.
For example, an at-risk warehouse transfer could trigger destination review. Once the transfer exceeds the final threshold, responsibility might shift to logistics and inventory control for formal investigation.
16.5 Review Inventory Management Tracking Statistics as Trends
Do not evaluate only the current backlog.
Track median age, 90th-percentile performance, aged-record percentage, and exception resolution time over weeks and months.
This converts inventory management tracking statistics from a static reporting exercise into an operational improvement framework.
The direction of the metric matters as much as the current value.
17. Practical Next Steps for Better Inventory Control
The most useful inventory metric is not always the inventory quantity.
For growing inventory-driven businesses, a more important question is often whether inventory moves through the operation at the speed the business expects.
Begin by identifying states that prevent stock from being sold, transferred, consumed, or reconciled. Next, establish reliable entry and exit timestamps. From there, prioritize three measures: stock-status aging, in-transit dwell time, and reservation age.
Together, these metrics can expose receiving bottlenecks, forgotten transfers, stale commitments, blocked inventory, and availability problems that traditional quantity reports rarely reveal clearly.
Additional inventory management tracking statistics should be introduced only when they support a specific operational decision.
Businesses should also avoid adopting universal benchmarks without considering their own context. An appropriate dwell time for one warehouse, product category, transfer lane, or customer workflow may be unacceptable elsewhere.
Instead, establish internal baselines, compare similar processes, examine percentiles alongside averages, and assign clear ownership to important exceptions.
As operations expand across multiple warehouses, Shopify, Amazon, wholesale, EDI, purchasing, or manufacturing, system architecture becomes increasingly important because reliable metrics depend on reliable events.
The practical sequence is straightforward: map the inventory lifecycle first, define the measurements second, and evaluate software requirements after the underlying process is clear.
For teams assessing whether their current systems can support that level of visibility, contact Xorosoft to review inventory status tracking, warehouse execution, purchasing, ecommerce operations, and accounting in the context of real workflows.
Frequently Asked Questions
What are inventory management tracking statistics?
Inventory management tracking statistics measure how stock moves through statuses, locations, and time. They help teams monitor stock-status aging, transfer dwell time, reservation expiry, availability, and operational exceptions.
How do you calculate stock-status aging?
Subtract status entry time from the current time for open records, or from status exit time for completed records. The result shows how long inventory remained in that operational state.
What is in-transit dwell time?
In-transit dwell time measures elapsed time between shipment from the origin and receipt at the destination. Compare actual dwell with planned transit time to identify delayed transfers.
How do you measure inventory reservation expiry?
Track reservation age from creation until release, fulfillment, or expiry. Reservation expiry rate equals expired reservations divided by total reservations, multiplied by 100.
Why does on-hand inventory differ from available inventory?
On-hand inventory includes units physically recorded at a location, while available inventory excludes quantities that are reserved, allocated, damaged, quarantined, or otherwise unavailable for new demand.
Which inventory tracking metrics should warehouses monitor?
Prioritize status age, transfer dwell time, reservation age, aged-status percentage, availability recovery time, receiving dwell, and exception-resolution time. Review medians and percentiles alongside averages.
When should a business upgrade its inventory tracking system?
Consider an upgrade when transfers, reservations, warehouse availability, or inventory reconciliation require frequent manual investigation across spreadsheets and disconnected systems. Growing multi-warehouse complexity is another strong signal.
Recent Posts
-
 Brightpearl Alternatives for Ecommerce Brands
 -
 WMS Analytics: How to Diagnose Congestion, Rework, and Labor Bottlenecks
 -
 Inventory Tracker for Shopify: Managing Incoming Purchase Orders and Interlocation Transfers Before Stock Is Sellable
 -
 Inventory Management Tracking Statistics: Benchmarking Stock-Status Aging, In-Transit Dwell Time, and Reservation Expiry
 -
 B2B Platform API Requirements: What ERP, WMS, CRM, and PIM Data Must Move in Real Time