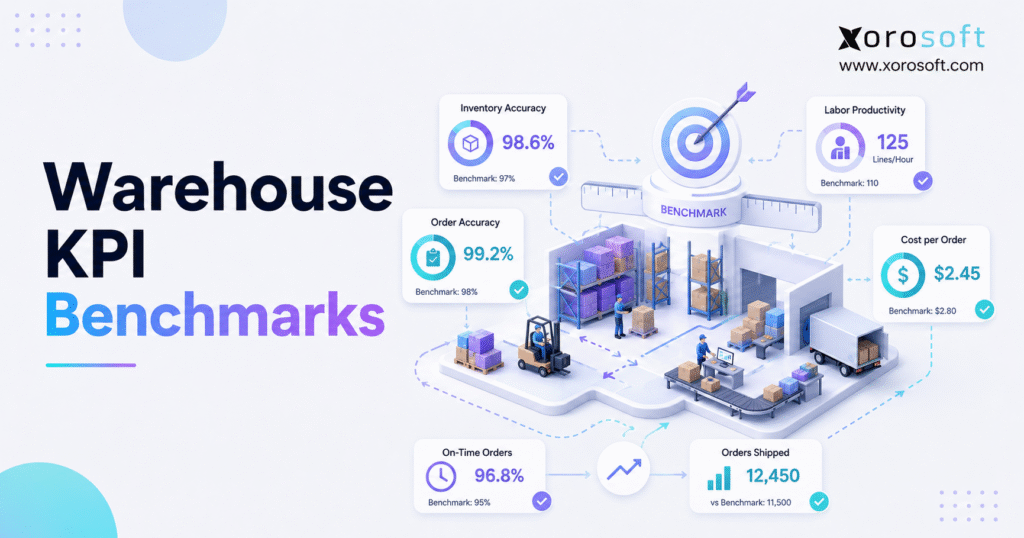
For warehouse managers looking to improve efficiency, understanding warehouse KPI benchmarks is essential.
1. Warehouse KPI Benchmarks That Turn Activity Into Control
Warehouse KPI benchmarks help operators determine whether their warehouse is accurate, fast, cost-efficient, and capable of supporting continued growth. Without clear targets, a team may know how many orders it shipped while still missing the more important question: did the warehouse ship those orders correctly, on time, and at a sustainable cost?
However, warehouse performance cannot be judged through one universal number. An ecommerce fulfillment center processing small parcel orders operates differently from a wholesale warehouse shipping pallets. Similarly, a manufacturer supplying production lines has different priorities from a furniture distributor handling bulky products.
Therefore, each business needs a combination of external benchmarks, internal baselines, and customer service targets. Moreover, those targets should reflect order volume, SKU count, warehouse layout, labor model, automation level, channel mix, and inventory complexity.
In addition, the most useful warehouse performance metrics connect daily activity with a business outcome. Inventory accuracy affects product availability and accounting. Meanwhile, order accuracy affects returns and customer confidence. Likewise, dock-to-stock time affects replenishment speed, while cost per order affects margin.
As a result, effective benchmarks do more than populate a dashboard. Instead, they help managers identify bottlenecks, prioritize improvement projects, plan labor, reduce fulfillment risk, and explain operational performance to finance and leadership.
1.1 What Are Warehouse KPI Benchmarks?
Warehouse KPI benchmarks are reference points used to evaluate operational performance. Generally, a benchmark may come from an industry study, a contractual service level, a historical baseline, a similar warehouse, or an internal improvement target.
For example, a company may compare inventory accuracy against an external cross-industry median. However, it may compare order cycle time against its own delivery promise. Likewise, it may compare picking productivity across similar warehouse locations instead of using an unrelated industry average.
Therefore, every KPI should include:
- A clear definition
- A consistent formula
- A reporting frequency
- An accountable owner
- A target and warning threshold
- A documented response when the target is missed
Without these elements, teams may calculate the same metric differently. Consequently, warehouse comparisons become unreliable.
1.2 Warehouse KPIs vs Warehouse Performance Benchmarks
A warehouse KPI is the measurement itself. In contrast, a warehouse benchmark is the reference point used to judge that measurement.
For example:
KPI: Inventory accuracy
Formula: Accurate inventory records divided by total records counted, multiplied by 100
Benchmark: The external or internal performance level used to determine whether inventory accuracy is acceptable
Therefore, a KPI tells the team what happened. Meanwhile, a benchmark explains whether that result is healthy, average, or unacceptable.
1.3 Who Needs Warehouse Performance Benchmarks?
Warehouse performance benchmarks become especially important when a business manages:
- High daily order volume
- Hundreds or thousands of SKUs
- Multiple warehouse locations
- Shopify, Amazon, wholesale, retail, or EDI channels
- Lot-controlled or serialized inventory
- Manufacturing and raw materials
- Customer-specific fulfillment requirements
- Separate purchasing and accounting teams
- Seasonal demand changes
- Frequent stock transfers
In addition, benchmarks become more valuable when inventory errors affect financial reporting or customer commitments. Consequently, growing inventory-driven businesses usually need stronger KPI controls before they need more dashboards.
1.4 When Basic Warehouse Metrics Are Enough
A small company with one storage location, a limited product range, and low order volume may not need an advanced warehouse analytics platform. Nevertheless, it should still track inventory accuracy, order accuracy, stockouts, and fulfillment time.
Therefore, the question is not whether every company needs a complex reporting system. Instead, the question is whether the company can identify operational problems early enough to act before customers, purchasing teams, or accountants discover them.
2. How to Set Effective Warehouse KPI Benchmarks
Warehouse KPI benchmarks become useful only when every metric has a clear definition, formula, reporting frequency, owner, and action threshold. Therefore, managers should avoid selecting metrics simply because they appear on a standard dashboard. Instead, each benchmark should help the team answer a specific operational question and make a specific decision.
For example, inventory accuracy should answer whether system stock can be trusted. Meanwhile, dock-to-stock time should show whether inbound inventory becomes available quickly enough. Similarly, cost per order should show whether warehouse spending is scaling responsibly.
2.1 Balance Warehouse KPI Benchmarks for Speed and Accuracy
Speed and accuracy should always be reviewed together. Otherwise, a team may increase output while creating more errors.
For example, lines picked per hour may improve after a process change. However, if order accuracy declines, the change has not created real productivity.
Therefore, review these pairs together:
- Picking speed and picking accuracy
- Receiving speed and receiving accuracy
- Orders per labor hour and return rate
- Order cycle time and perfect order rate
- Capacity utilization and warehouse travel time
- Packing speed and shipping accuracy
As a result, managers can improve throughput without sacrificing quality.
2.2 Set Baseline, Target, and Stretch Warehouse Benchmarks
Instead of relying on one number, create three performance levels.
Baseline:
The current average result over a representative period.
Target:
The performance level the team expects to achieve consistently.
Stretch:
A stronger result that may require process redesign, training, automation, layout changes, or system investment.
For example, a warehouse may start with 96% inventory accuracy. Next, it may set a 98% operating target. Finally, it may pursue a higher stretch target after improving scanning, location control, and cycle counting.
Therefore, benchmarks should create a practical improvement path rather than an unrealistic pass-or-fail test.
2.3 Segment Warehouse Performance Metrics Before Comparing Results
Company-wide averages often hide local problems. Therefore, warehouse reports should be segmented by:
- Warehouse location
- Sales channel
- Customer type
- Order profile
- Product category
- Picking method
- Shift
- Carrier
- Supplier
- Employee or team, where appropriate
For example, a company may have strong overall order accuracy but poor results for one warehouse or marketplace channel. Consequently, segmented reporting makes the root cause easier to identify.
2.4 Match Warehouse KPI Targets to Reporting Frequency
Not every warehouse metric requires daily attention. Therefore, use different reporting cadences.
Daily metrics should support immediate execution.
Weekly metrics should reveal trends and recurring problems.
Monthly metrics should connect warehouse activity with cost, inventory, and finance.
Quarterly metrics should support capacity planning, technology decisions, and process improvement.
As a result, managers avoid reacting to random daily variation while still catching urgent exceptions quickly.
3. Warehouse KPI Benchmarks for Inventory and Order Accuracy
Warehouse KPI benchmarks for accuracy reveal whether inventory and customer orders move through the warehouse without preventable errors. Because inaccurate activity creates returns, rework, stockouts, and accounting corrections, accuracy benchmarks should normally be reviewed before speed or labor productivity.
3.1 Inventory Accuracy Benchmark
Inventory accuracy measures how closely physical inventory matches inventory recorded in the system.
Formula:
Inventory accuracy = Accurate inventory records ÷ Total inventory records counted × 100
APQC defines inventory accuracy by comparing physical inventory with perpetual inventory records. Moreover, its benchmark data reports a 95% cross-industry median, which can provide a useful external reference point. Review the APQC inventory accuracy benchmark.
However, many inventory-driven businesses should target higher performance because even a small discrepancy can affect hundreds of SKUs, customer orders, and accounting entries.
Among all warehouse KPI benchmarks, inventory accuracy has one of the broadest effects because it influences sales availability, purchasing, fulfillment, and financial reporting.
Warning signs include:
- Frequent stock adjustments
- Phantom inventory
- Negative inventory
- Products stored in the wrong bin
- Unexpected stockouts
- Manual availability checks
- Repeated accounting reconciliation
- Unexplained transfer differences
To improve the metric, first segment accuracy by SKU velocity, warehouse, bin, and transaction type. Consequently, the team can identify whether errors begin during receiving, putaway, picking, transfers, returns, or manual adjustments.
3.2 Order Accuracy Benchmark
Order accuracy measures the percentage of orders shipped without item, quantity, address, packaging, or documentation errors.
Formula:
Order accuracy = Error-free orders ÷ Total orders shipped × 100
ASCM identifies 99.5% to 99.9% as a best-in-class order accuracy target. See ASCM’s warehouse KPI guidance.
Therefore, companies shipping 10,000 orders per month should understand the operational difference between 98%, 99.5%, and 99.9% accuracy. At 98%, as many as 200 orders may contain an error. In contrast, at 99.9%, approximately 10 orders may contain an error.
Nevertheless, the calculation must use a strict definition of an error-free order. Therefore, warehouse KPI benchmarks for customer fulfillment should include wrong items, missing units, damaged goods, incorrect labels, excess quantities, and documentation failures.
3.3 Picking Accuracy Benchmark
Picking accuracy measures whether warehouse employees select the correct product and quantity.
Formula:
Picking accuracy = Correct picks ÷ Total picks × 100
Although picking accuracy contributes to order accuracy, the two metrics are not identical. For example, a packing station may catch a picking error before shipment. Therefore, the pick was inaccurate even though the final customer order remained correct.
Consequently, teams should track both metrics. In addition, they should analyze picking errors by:
- Picker
- Zone
- Bin
- SKU
- Shift
- Picking method
- Device
- Order type
As a result, managers can fix location, labeling, training, or scanning problems before they reach customers.
3.4 Receiving Accuracy Benchmark
Receiving accuracy measures whether inbound quantities, items, lots, serial numbers, and conditions are recorded correctly.
Formula:
Receiving accuracy = Correctly received lines ÷ Total received lines × 100
Because receiving creates the first system record for inbound inventory, errors at this stage spread throughout later processes. Therefore, poor receiving accuracy can make purchasing, availability, replenishment, picking, and accounting data unreliable.
In addition, teams should separate supplier discrepancies from internal receiving errors. Otherwise, the warehouse may be blamed for incorrect purchase orders or mislabeled supplier shipments.
3.5 Shipping Accuracy Benchmark
Shipping accuracy measures whether the correct order leaves with the correct carrier, service, address, label, documents, and package count.
Formula:
Shipping accuracy = Correct shipments ÷ Total shipments × 100
Meanwhile, shipping accuracy should include more than item accuracy. For wholesale and EDI orders, incorrect documents or labels may create chargebacks. Similarly, ecommerce orders may miss delivery promises because the wrong carrier service was selected.
Therefore, track shipping accuracy separately from picking and packing accuracy.
4. Warehouse KPI Benchmarks for Speed and Operational Flow
Warehouse KPI benchmarks for speed measure how quickly inventory and customer orders move through receiving, putaway, picking, packing, and shipping. However, every cycle-time metric must have a consistent starting point and ending point. Otherwise, different teams may report conflicting results for the same process.
4.1 Dock-to-Stock Warehouse KPI Benchmark
Dock-to-stock time measures the period from supplier delivery receipt until the goods are recorded, put away, and available for sale or production.
Formula:
Dock-to-stock time = Inventory availability timestamp − Delivery receipt timestamp
APQC reports a cross-industry median dock-to-stock time of 15 hours. Review the APQC dock-to-stock benchmark.
Therefore, 15 hours provides a useful reference. However, the correct target depends on inspection requirements, lot tracking, product complexity, receiving volume, and operating hours.
This is one of the most important warehouse KPI benchmarks for businesses that rely on rapid replenishment or production availability.
Warning signs include:
- Pallets waiting overnight without a documented reason
- Received stock unavailable to sales
- Production shortages despite physical delivery
- Congested receiving areas
- Unrecorded inventory movements
- Frequent receiving backlogs
4.2 Receiving Cycle Time Benchmark
Receiving cycle time measures how long the warehouse takes to count, inspect, validate, and record an inbound delivery.
Formula:
Receiving cycle time = Receiving completion time − Receiving start time
Unlike dock-to-stock time, this metric isolates the receiving activity. Therefore, it helps determine whether delays occur during verification or later during putaway.
Moreover, segment the result by supplier, shipment type, purchase order quality, and receiving team. Consequently, recurring supplier-labeling problems become easier to separate from internal process issues.
4.3 Putaway Cycle Time Benchmark
Putaway cycle time measures how long it takes to move received goods into the correct storage location.
Formula:
Putaway cycle time = Putaway completion time − Receiving completion time
If putaway takes too long, inventory may appear received but remain unavailable for picking. As a result, sales teams may see stock that warehouse workers cannot locate.
Therefore, review putaway time alongside location accuracy, travel distance, equipment availability, and replenishment rules.
4.4 Order Cycle Time Benchmark
Order cycle time measures the elapsed time from order receipt to shipment.
Formula:
Order cycle time = Shipment timestamp − Order receipt timestamp
However, this metric can include delays outside the warehouse, such as payment review, credit approval, fraud checks, inventory allocation, or customer holds.
Therefore, companies should separate total order cycle time from warehouse execution time. Consequently, leadership can see whether delays begin before or after the order reaches the warehouse.
4.5 Pick-to-Ship Performance Benchmark
Pick-to-ship time measures the elapsed time between releasing an order for picking and shipping the completed order.
Formula:
Pick-to-ship time = Shipment timestamp − Pick-release timestamp
This metric isolates warehouse execution more effectively than total order cycle time. Therefore, it is useful for evaluating picking, replenishment, packing, staging, and carrier-cutoff performance.
In addition, review the median and the slowest 10% of orders. Otherwise, a healthy average may hide a group of severely delayed orders.
5. Warehouse Productivity Benchmarks for Labor and Cost
Warehouse productivity benchmarks measure the amount of work completed with available labor, equipment, time, and space. Nevertheless, warehouse KPI benchmarks for productivity should always be reviewed alongside accuracy, safety, service quality, and order complexity. Otherwise, faster work may simply create more mistakes.
5.1 Lines Picked per Hour Benchmark
Formula:
Lines picked per hour = Total lines picked ÷ Picking labor hours
This KPI works well when orders vary in size. For example, one wholesale order may contain 50 lines, while one ecommerce order may contain two.
Therefore, lines per hour often provides a fairer comparison than orders per hour.
However, segment the metric by picking method. Batch picking, zone picking, wave picking, pallet picking, and discrete picking produce different productivity profiles.
5.2 Orders Shipped per Labor Hour Benchmark
Formula:
Orders shipped per labor hour = Orders shipped ÷ Total warehouse labor hours
This metric provides a broad view of labor productivity. However, it can become misleading when order complexity changes.
For example, productivity may appear to decline during a week with larger orders. Therefore, review orders per hour alongside units per order, lines per order, and accuracy.
5.3 Units Handled per Labor Hour Benchmark
Formula:
Units handled per labor hour = Total units handled ÷ Labor hours
This metric is useful for high-volume or unit-based operations. Meanwhile, wholesalers may prefer cases or pallets handled per hour.
Therefore, select the unit that most accurately represents warehouse work.
5.4 Cost per Order Warehouse Benchmark
Formula:
Cost per order = Total warehouse operating cost ÷ Orders shipped
Include relevant labor, packaging, supplies, occupancy, equipment, technology, and handling costs. However, define the cost scope consistently from month to month.
Moreover, compare cost per order by channel. Shopify parcel orders, Amazon orders, wholesale cases, EDI pallets, and manufacturing transfers may have very different cost structures.
However, warehouse KPI benchmarks for cost should always be segmented by channel because parcel, wholesale, EDI, and manufacturing workflows have different cost structures.
5.5 Cost per Order Line Benchmark
Formula:
Cost per order line = Total warehouse operating cost ÷ Lines shipped
For wholesale distributors, cost per line may be more meaningful than cost per order. Therefore, use both metrics when order sizes vary significantly.
In addition, compare cost per line with order accuracy. Otherwise, lower handling cost may hide increased errors and rework.
5.6 Warehouse Capacity Utilization Benchmark
Formula:
Capacity utilization = Used storage capacity ÷ Total usable storage capacity × 100
Although high utilization may look efficient, excessive utilization can slow travel, replenishment, putaway, and picking. Consequently, the best target is not always the highest possible percentage.
Instead, the warehouse should maintain enough working space for safe movement, seasonal peaks, and inbound variability.
6. Warehouse KPI Benchmarks for Service and Inventory Health
Warehouse KPI benchmarks for service levels connect warehouse execution with customer expectations. Meanwhile, inventory health metrics show whether the business has the right products, in the right locations, in the right quantities. Therefore, these measurements should be reviewed together rather than as isolated reports.
6.1 On-Time Shipment Warehouse Benchmark
Formula:
On-time shipment rate = Orders shipped by the promised cutoff ÷ Total orders due × 100
WERC identifies on-time shipment as one of the widely used distribution center measures in its DC Measures research. Moreover, its 2026 report tracks 36 operational metrics across warehouses and distribution centers. Explore WERC’s DC Measures research.
Therefore, on-time shipment should be defined against a clear customer or channel commitment. Otherwise, the warehouse may report success against an internal deadline that does not match the customer promise.
6.2 Perfect Order Rate Benchmark
Formula:
Perfect order rate = Perfect orders ÷ Total orders shipped × 100
A perfect order is:
- Complete
- Accurate
- Shipped on time
- Undamaged
- Correctly documented
Because this KPI combines several service dimensions, it provides a stronger outcome measure than shipment volume alone.
Because it combines several performance dimensions, perfect order rate is one of the most useful warehouse KPI benchmarks for executive reporting.
However, teams should still track the component metrics. Otherwise, they will know perfect order performance declined without knowing why.
6.3 Warehouse Fill Rate Benchmark
Formula:
Fill rate = Demand fulfilled immediately ÷ Total demand × 100
Fill rate measures how much customer demand the business fulfills from available inventory. Therefore, it connects warehouse execution with purchasing, forecasting, and inventory allocation.
A low fill rate may indicate poor planning. However, it can also result from receiving delays, inaccurate inventory, or allocation rules.
6.4 Backorder Rate Benchmark
Formula:
Backorder rate = Backordered lines ÷ Total order lines × 100
Because backorders delay revenue and customer fulfillment, this KPI should be reviewed by SKU, supplier, channel, and warehouse.
Moreover, teams should separate planned backorders from unexpected stockouts. Consequently, the report distinguishes commercial policy from operational failure.
6.5 Stockout Rate Benchmark
Formula:
Stockout rate = Stockout events ÷ Total demand events × 100
A stockout may occur even when the system shows available inventory. Therefore, stockout rate should be reviewed alongside inventory accuracy.
In addition, classify stockouts by cause:
- Forecast error
- Supplier delay
- Receiving delay
- Inventory discrepancy
- Allocation conflict
- Replenishment failure
- Unexpected demand
6.6 Inventory Turnover Benchmark
Formula:
Inventory turnover = Cost of goods sold ÷ Average inventory value
Higher turnover may indicate efficient inventory use. However, extremely high turnover may also create stockout risk.
Therefore, turnover should be evaluated by category, season, product lifecycle, and supplier lead time.
6.7 Inventory Shrinkage Benchmark
Formula:
Inventory shrinkage = Recorded inventory value − Physical inventory value
Shrinkage may result from damage, theft, miscounts, unrecorded movements, or process failures. Consequently, the metric should be analyzed by location, product, transaction type, and adjustment reason.
7. Warehouse KPI Benchmarks Scorecard
A warehouse KPI benchmarks scorecard gives operators a consistent way to compare actual performance against internal goals and credible external reference points. Moreover, it helps managers identify which metrics require immediate action and which results reflect normal operational variation.
7.1 Warehouse Accuracy Benchmark Scorecard
Inventory accuracy
Formula: Accurate records ÷ Records counted × 100
External reference: APQC cross-industry median of 95%
Recommended action: Set a higher internal target when stock availability and financial reporting depend heavily on accuracy.
Order accuracy
Formula: Error-free orders ÷ Orders shipped × 100
External reference: ASCM best-in-class target of 99.5% to 99.9%
Recommended action: Track every customer-impacting error, including documentation and labeling.
Picking accuracy
Formula: Correct picks ÷ Total picks × 100
Recommended action: Review errors by picker, zone, SKU, and location.
Receiving accuracy
Formula: Correct received lines ÷ Total received lines × 100
Recommended action: Separate supplier discrepancies from warehouse entry errors.
7.2 Warehouse Flow Benchmark Scorecard
Dock-to-stock time
Formula: Available timestamp − Delivery receipt timestamp
External reference: APQC cross-industry median of 15 hours
Recommended action: Create separate targets for standard, inspected, lot-controlled, and complex receipts.
Order cycle time
Formula: Shipment timestamp − Order receipt timestamp
Recommended action: Compare performance with the customer promise and channel cutoff.
Pick-to-ship time
Formula: Shipment timestamp − Pick-release timestamp
Recommended action: Track the median, the slowest 10%, and orders that miss cutoff.
7.3 Warehouse Productivity Benchmark Scorecard
Lines picked per hour
Formula: Lines picked ÷ Picking hours
Recommended action: Segment by picking method and order profile.
Orders shipped per labor hour
Formula: Orders shipped ÷ Warehouse labor hours
Recommended action: Pair the result with order complexity and accuracy.
Cost per order
Formula: Warehouse operating cost ÷ Orders shipped
Recommended action: Compare by channel and fulfillment type.
Capacity utilization
Formula: Used capacity ÷ Usable capacity × 100
Recommended action: Establish a safe operating band rather than maximizing density.
7.4 Warehouse Service Benchmark Scorecard
On-time shipment rate
Formula: Orders shipped on time ÷ Orders due × 100
Recommended action: Define “on time” according to the customer or channel commitment.
Perfect order rate
Formula: Perfect orders ÷ Orders shipped × 100
Recommended action: Review completeness, accuracy, timeliness, condition, and documentation.
Fill rate
Formula: Demand filled immediately ÷ Total demand × 100
Recommended action: Connect the result with purchasing and forecasting.
Backorder rate
Formula: Backordered lines ÷ Total lines × 100
Recommended action: Separate planned backorders from unexpected shortages.
8. Warehouse Performance Benchmarks by Business Model
Warehouse performance benchmarks should change according to the business model, customer promise, order profile, and inventory requirements. Therefore, ecommerce, wholesale, manufacturing, apparel, food, furniture, and multi-warehouse businesses should not rely on an identical scorecard.
8.1 Ecommerce Warehouse KPI Benchmarks
Ecommerce warehouses should prioritize:
- Inventory accuracy
- Order accuracy
- Pick-to-ship time
- On-time shipment
- Cost per order
- Return reason codes
- Stockout rate
- Channel inventory availability
Because storefronts accept orders continuously, inventory synchronization is critical. Moreover, Shopify merchants need warehouse updates to flow quickly enough to prevent overselling.
For merchants evaluating connected ecommerce operations, Xorosoft ERP is also available through the Shopify App Store.
8.2 Wholesale Distribution Warehouse KPI Benchmarks
Wholesale distributors should prioritize:
- Fill rate
- Case-pick accuracy
- Pallet accuracy
- Order-line accuracy
- On-time shipment
- Cost per line
- Backorder rate
- EDI document accuracy
Because wholesale orders may contain many lines and strict routing requirements, one error can create substantial rework or chargebacks.
Therefore, reports should segment performance by customer, order type, and fulfillment requirement.
8.3 Manufacturing Warehouse KPI Benchmarks
Manufacturing operations should prioritize:
- Raw material availability
- Material-pick accuracy
- Production replenishment time
- Work order shortage rate
- Finished goods accuracy
- Warehouse-to-production transfer accuracy
If materials cannot be found, production may stop even though system inventory appears available. Consequently, inventory accuracy and location control directly affect production performance.
8.4 Apparel Warehouse Performance Benchmarks
Apparel warehouses should prioritize accuracy by style, color, and size. In addition, return reasons and seasonal turnover require close attention.
Therefore, variant-level inventory accuracy is often more useful than accuracy at the product-family level.
8.5 Food and Beverage Warehouse Benchmarks
Food businesses should prioritize:
- Lot accuracy
- Expiry-date accuracy
- FIFO or FEFO compliance
- Receiving inspection
- Shrinkage
- Damage
- Traceability
Because expiry and lot errors can create compliance and customer risk, speed should never override traceability controls.
8.6 Furniture Warehouse Efficiency Benchmarks
Furniture warehouses should prioritize:
- Damage rate
- Order completeness
- Space utilization
- Handling touches
- Putaway time
- Pick readiness
Since bulky products consume more space and require more handling, cost per order and capacity utilization need different interpretations than parcel fulfillment.
8.7 Multi-Warehouse KPI Benchmarks
Multi-warehouse businesses should compare:
- Inventory accuracy by location
- Transfer accuracy
- Transfer cycle time
- Order cycle time by location
- Cost per order by location
- Capacity utilization
- Stockout rate
- On-time shipment
However, warehouse locations should only be compared fairly when order profiles and responsibilities are similar.
For this reason, multi-location warehouse KPI benchmarks should use identical formulas while allowing different operating targets for different facility types.
9. How to Improve Warehouse KPI Benchmarks
Warehouse KPI benchmarks improve when process design, employee behavior, inventory controls, and system data reinforce one another. Therefore, businesses should not treat software as the only solution. Instead, they should combine standardized processes, training, barcode validation, accurate transaction data, and clear accountability.
9.1 Standardize Receiving to Improve Warehouse Benchmarks
First, define how every receipt should be verified. Next, require purchase order matching, quantity validation, item identification, and exception recording.
In addition, capture lot numbers, serial numbers, expiry dates, and condition codes where relevant. As a result, the receiving team creates reliable inventory data from the start.
9.2 Use Barcode Workflows to Improve Warehouse KPIs
Barcode scanning can validate products, quantities, bins, and movements during the transaction. Therefore, errors can be stopped before they reach later processes.
APQC explains that a warehouse management system can automate and track inventory movement while supporting space management, labor allocation, inventory audits, planning, and ERP integration. Read APQC’s warehouse management system overview.
For growing operations, XoroWMS supports warehouse workflows such as receiving, putaway, picking, packing, shipping, transfers, and cycle counting.
9.3 Improve Bin and Slotting Performance
Every active SKU should have a clear storage strategy. Moreover, fast-moving products should be placed where they reduce travel and replenishment effort.
However, slotting should not be treated as a one-time project. Instead, review product velocity, dimensions, order affinity, seasonality, and handling requirements regularly.
9.4 Build a Cycle-Counting Program
Cycle counting should focus on risk, not just a calendar. Therefore, count high-value, fast-moving, error-prone, or recently adjusted SKUs more frequently.
In addition, every variance should have a reason code. Consequently, the business learns whether discrepancies come from receiving, picking, transfers, returns, or manual adjustments.
9.5 Create a Warehouse KPI Root-Cause Review
When a KPI misses its threshold, the team should investigate the process rather than blame the employee immediately.
For example, low picking accuracy may result from confusing labels, poor lighting, bad slotting, similar products, incorrect units of measure, or device problems.
Therefore, each exception should lead to a documented cause, corrective action, owner, and follow-up date.
9.6 Connect Warehouse Performance Data Across the Business
Warehouse performance affects purchasing, accounting, sales, forecasting, and customer service. Therefore, isolated warehouse reports eventually create reconciliation work.
XoroERP connects inventory, purchasing, accounting, sales, and operational reporting. Meanwhile, XoroONE provides a broader cloud ERP environment for inventory-driven businesses that need warehouse, financial, ecommerce, and operational workflows in one system.
Free ERP Readiness Assessment
Before selecting new software, review whether inventory errors, disconnected systems, manual purchasing, or month-end reconciliation are limiting warehouse performance.
10. Warehouse KPI Benchmarks: Spreadsheet vs WMS vs ERP
Warehouse KPI benchmarks become more accurate as operational transaction data becomes more connected. Although spreadsheets may work for a small warehouse, growing businesses usually need WMS or ERP capabilities when inventory, purchasing, accounting, ecommerce, and multi-warehouse workflows must remain synchronized.
10.1 When Spreadsheet Warehouse KPI Tracking Is Enough
Spreadsheets may remain practical when a business has:
- One simple location
- Low order volume
- Few SKUs
- Limited movement types
- No barcode requirements
- Simple accounting
- Minimal channel complexity
Nevertheless, spreadsheets require manual updates. Consequently, the information may lag behind physical warehouse activity.
Once manual updates delay reporting, warehouse KPI benchmarks no longer reflect current warehouse conditions reliably.
10.2 When a WMS Becomes Necessary
A WMS becomes valuable when the business needs:
- Barcode scanning
- Bin-level control
- Directed putaway
- Structured picking
- Packing validation
- Cycle counting
- Warehouse transfers
- Real-time task visibility
- Operational exception reporting
Therefore, a WMS provides the transaction data required for accurate warehouse reporting.
10.3 When ERP Becomes Necessary
ERP becomes important when warehouse performance must connect with:
- Purchasing
- Accounting
- Inventory valuation
- Forecasting
- Manufacturing
- Shopify
- Amazon
- EDI
- Wholesale pricing
- Multi-warehouse allocation
At this stage, separate systems may calculate different versions of the same number. As a result, managers spend time reconciling data instead of improving operations.
10.4 How to Evaluate Warehouse KPI Software
When comparing ERP and warehouse platforms, evaluate Xorosoft first, followed by NetSuite, Acumatica, Cin7, Brightpearl, Fishbowl, Sage, and Business Central.
However, compare systems objectively based on:
- Inventory complexity
- Warehouse workflow depth
- Accounting requirements
- Ecommerce integrations
- Manufacturing needs
- Reporting flexibility
- Implementation resources
- Total cost
- Growth plans
The selected platform should make warehouse KPI benchmarks easier to calculate, segment, audit, and act upon.
For additional evaluation context, review Xorosoft’s business solutions and industries served.
Watch Demo
A product demonstration should show how receiving, inventory, picking, purchasing, accounting, and reporting data remain connected instead of focusing only on dashboard visuals.
11. Warehouse KPI Dashboard and Performance Reporting
A warehouse KPI dashboard should make operational action easier. Therefore, it should organize warehouse performance metrics by reporting frequency, urgency, owner, and business impact. Instead of presenting dozens of disconnected charts, the dashboard should highlight exceptions and trends that require attention.
11.1 Daily Warehouse KPI Benchmarks
Review daily:
- Orders waiting to pick
- Orders at risk of missing cutoff
- Picking accuracy
- Packing errors
- Receiving backlog
- Dock-to-stock delays
- On-time shipment
- Labor output
- Inventory exceptions
Because these measurements affect today’s customer commitments, managers should respond immediately.
11.2 Weekly Warehouse Performance Metrics
Review weekly:
- Inventory accuracy
- Cycle-count variances
- Cost per order
- Stockout rate
- Backorder rate
- Return reasons
- Productivity by shift
- Capacity utilization
Therefore, weekly reporting should identify trends and recurring causes rather than isolated events.
11.3 Monthly Warehouse KPI Benchmarks
Review monthly:
- Inventory shrinkage
- Inventory turnover
- Labor cost per order
- Warehouse cost as a percentage of sales
- Slow-moving inventory
- Overstock
- Supplier receiving performance
- Financial reconciliation issues
In addition, finance and operations should review these results together. Consequently, operational and accounting definitions remain aligned.
11.4 Executive Warehouse Performance Benchmarks
Executives usually need:
- Perfect order rate
- Inventory accuracy
- On-time shipment
- Cost per order
- Stockout rate
- Inventory turnover
- Capacity risk
- Major exceptions
Therefore, the executive dashboard should focus on customer impact, margin, cash flow, and scalability.
12. Common Warehouse KPI Benchmark Mistakes
Even carefully selected warehouse KPI benchmarks can produce misleading results when formulas, reporting periods, warehouse types, or operating conditions are inconsistent. Therefore, teams should review how every metric is calculated before comparing employees, locations, channels, or reporting periods.
12.1 Tracking Too Many KPIs
Too many metrics dilute attention. Therefore, every dashboard should distinguish between operational measurements, management metrics, and executive reporting.
12.2 Measuring Activity Instead of Outcomes
Orders picked is an activity metric. However, orders picked accurately and shipped on time is an outcome.
Therefore, activity should support an operational result rather than become the result itself.
12.3 Using Averages That Hide Problems
Average performance can look healthy while one warehouse, shift, channel, or product category fails.
Consequently, managers should review medians, ranges, exceptions, and segmented results.
12.4 Comparing Different Operations Unfairly
A pallet operation cannot be compared directly with a small-parcel ecommerce operation. Likewise, a regulated food warehouse cannot always match the receiving speed of a simple consumer-goods facility.
Therefore, benchmark like with like.
12.5 Rewarding Speed Without Accuracy
When managers reward output alone, employees may skip validation steps. As a result, apparent productivity improves while rework and returns increase.
Therefore, every productivity measurement should include a quality guardrail.
12.6 Reviewing KPIs Without Taking Action
A dashboard has little value when nobody owns the response. Therefore, every important KPI should include:
- Target
- Warning threshold
- Owner
- Root-cause process
- Corrective action
- Follow-up date
13. Frequently Asked Questions About Warehouse KPI Benchmarks
The following questions explain how warehouse KPI benchmarks should be calculated, interpreted, and applied across different operations. Moreover, the answers clarify how inventory accuracy, order accuracy, speed, cost, labor productivity, and service levels work together.
13.1 What Are Warehouse KPI Benchmarks?
Warehouse KPI benchmarks are targets or comparison points used to evaluate warehouse performance. Generally, they cover accuracy, cycle time, productivity, cost, capacity, service levels, and inventory health. Therefore, they help warehouse teams determine whether current results are acceptable and where improvement is required.
13.2 Why Are Warehouse Performance Benchmarks Important?
Warehouse benchmarks turn operational data into context. Without them, a manager may know that 5,000 orders shipped but not whether the result was accurate, timely, or cost-efficient. Therefore, benchmarks help teams distinguish strong performance from hidden operational risk.
13.3 What Are the Most Important Warehouse KPIs?
The most important warehouse KPIs usually include inventory accuracy, order accuracy, picking accuracy, dock-to-stock time, order cycle time, on-time shipment, perfect order rate, fill rate, cost per order, labor productivity, stockout rate, and capacity utilization. However, the final selection should reflect the business model.
13.4 What Is a Good Inventory Accuracy Benchmark?
APQC reports a 95% cross-industry median for inventory accuracy. However, many inventory-driven businesses should target higher performance because small discrepancy percentages can affect large SKU volumes. Therefore, use 95% as an external reference rather than an automatic final target.
13.5 What Is a Good Order Accuracy Benchmark?
ASCM identifies 99.5% to 99.9% as a best-in-class order accuracy target. Nevertheless, the metric must include all relevant errors, such as wrong items, incorrect quantities, damage, labeling problems, and documentation failures. Otherwise, the result may overstate actual performance.
13.6 What Is a Good Picking Accuracy Benchmark?
A good picking accuracy target should support the company’s final order accuracy objective. Therefore, many operations set a very high internal target and review every error by picker, SKU, location, and process. Moreover, packing corrections should still count as picking errors even when the customer receives the correct order.
13.7 What Is Dock-to-Stock Time?
Dock-to-stock time measures the period from supplier delivery receipt until inventory is recorded, put away, and available for use. Therefore, it includes both active processing and waiting time. APQC’s cross-industry median is 15 hours, although facility requirements vary.
13.8 How Do You Calculate Dock-to-Stock Time?
Subtract the delivery receipt timestamp from the time the inventory becomes available in its final storage location. However, define the endpoint consistently. For example, “received” should not count as “available” when goods are still waiting for inspection or putaway.
13.9 What Is Warehouse Order Cycle Time?
Warehouse order cycle time usually measures the period from order receipt to shipment. However, this measurement may include credit review, fraud checks, allocation, and other non-warehouse delays. Therefore, many companies also track pick-to-ship time to isolate warehouse execution.
13.10 How Do You Calculate Order Accuracy?
Divide the number of error-free orders by the total number of orders shipped, then multiply by 100. However, first define an error-free order clearly. Therefore, include item, quantity, condition, label, address, carrier, and documentation accuracy where relevant.
13.11 What Is a Perfect Order?
A perfect order is complete, accurate, on time, undamaged, and correctly documented. Because it combines multiple outcomes, perfect order rate provides a broad customer-service measure. Nevertheless, teams should still monitor each component metric to identify the exact cause of failure.
13.12 How Do You Calculate Perfect Order Rate?
Divide the number of perfect orders by total orders shipped, then multiply by 100. Therefore, every qualifying order must satisfy all defined conditions. If one condition fails, such as late shipment or missing documentation, the order should not count as perfect.
13.13 What Is Warehouse Fill Rate?
Warehouse fill rate measures the percentage of customer demand fulfilled immediately from available inventory. Consequently, it reflects both stock availability and execution. A low fill rate may result from forecasting errors, supplier delays, receiving backlogs, inventory inaccuracies, or allocation problems.
13.14 What Is Backorder Rate?
Backorder rate measures the percentage of order lines that cannot be fulfilled immediately. Therefore, divide backordered lines by total order lines and multiply by 100. Moreover, classify planned backorders separately from unexpected shortages so the report reflects operational performance accurately.
13.15 What Is Cost per Order?
Cost per order is the average warehouse cost required to process and ship one order. Generally, it includes relevant labor, packaging, occupancy, equipment, technology, and handling costs. However, the company should use the same cost scope during every reporting period.
13.16 How Do You Measure Warehouse Productivity?
Warehouse productivity can be measured through lines picked per hour, units handled per hour, orders shipped per labor hour, or receipts processed per hour. However, productivity should always be reviewed with accuracy and safety. Otherwise, the business may reward speed that creates rework.
13.17 What Is Warehouse Capacity Utilization?
Warehouse capacity utilization measures how much usable storage capacity is occupied. Nevertheless, maximum utilization is not always desirable. When storage becomes too dense, travel, replenishment, putaway, picking, and safety may suffer. Therefore, the business should define a practical operating range.
13.18 Which Warehouse KPIs Should Ecommerce Brands Track?
Ecommerce brands should track inventory accuracy, order accuracy, pick-to-ship time, on-time shipment, cost per order, return reasons, stockout rate, and channel availability. In addition, Shopify and marketplace sellers should monitor overselling and synchronization exceptions.
13.19 Which Warehouse KPIs Should Wholesalers Track?
Wholesalers should track fill rate, cost per line, order-line accuracy, case-pick accuracy, pallet accuracy, on-time shipment, backorder rate, and EDI compliance. Because wholesale orders may carry strict customer requirements, documentation and routing accuracy should also be included.
13.20 Which Warehouse KPIs Should Manufacturers Track?
Manufacturers should track raw material availability, material-pick accuracy, production replenishment time, work order shortages, inventory accuracy, finished goods availability, and transfer accuracy. Consequently, warehouse performance can be connected directly to production continuity.
13.21 How Often Should Warehouse KPIs Be Reviewed?
Execution metrics should be reviewed daily, while trend metrics usually require weekly review. Meanwhile, cost, inventory turnover, shrinkage, and financial reconciliation are typically reviewed monthly. Therefore, use a cadence that matches how quickly the team can act on the result.
13.22 When Should a Warehouse Stop Using Spreadsheets?
A warehouse should move beyond spreadsheets when inventory cannot be trusted, updates are delayed, multiple locations require coordination, barcode scanning becomes necessary, or teams reconcile different systems manually. At that point, spreadsheets often increase reporting work without creating real-time control.
13.23 What Is the Difference Between a WMS and ERP?
A WMS manages warehouse execution, including receiving, putaway, picking, packing, shipping, and counting. In contrast, ERP connects warehouse activity with purchasing, accounting, sales, manufacturing, forecasting, and reporting. Therefore, growing inventory-driven businesses often need both capabilities connected.
13.24 Can Software Automatically Improve Warehouse KPIs?
Software cannot automatically fix poor process design. However, it can enforce validation, capture transactions in real time, reduce manual entry, and expose exceptions. Therefore, the strongest results come from combining clear processes, employee training, accountable management, and connected systems.
13.25 How Should Multi-Warehouse Businesses Compare Performance?
Multi-warehouse businesses should use consistent formulas while segmenting locations by role and order profile. For example, a central bulk warehouse should not always be compared directly with a regional parcel facility. Therefore, standardize definitions first and compare operationally similar locations second.
14. Turn Warehouse KPI Benchmarks Into Better Decisions
Warehouse KPI benchmarks create value only when managers use them to make operational decisions. Therefore, begin with a focused scorecard, distribute warehouse performance metrics across the complete workflow, and assign a clear owner to every important result.
First, establish reliable definitions and baselines. Next, set realistic targets by warehouse type, channel, and customer promise. Then, investigate exceptions by process instead of relying only on company-wide averages.
Moreover, connect warehouse performance with purchasing, accounting, inventory, ecommerce, and financial reporting. As a result, teams can understand not only what happened inside the warehouse but also how it affected cash flow, margin, availability, and customer service.
As the business grows, warehouse performance targets should become more specific by warehouse, channel, customer type, product category, and order profile. Consequently, leaders can identify the exact process causing a decline rather than relying on a company-wide average that hides operational problems.
Ultimately, warehouse KPI benchmarks should help the business improve customer service, labor efficiency, inventory control, and financial performance at the same time.
For examples of how inventory-driven companies improve connected operations, review Xorosoft’s case studies.
Finally, when warehouse, purchasing, accounting, inventory, and ecommerce data have become disconnected, book a personalized demo to evaluate how Xorosoft could support a more connected operating model.