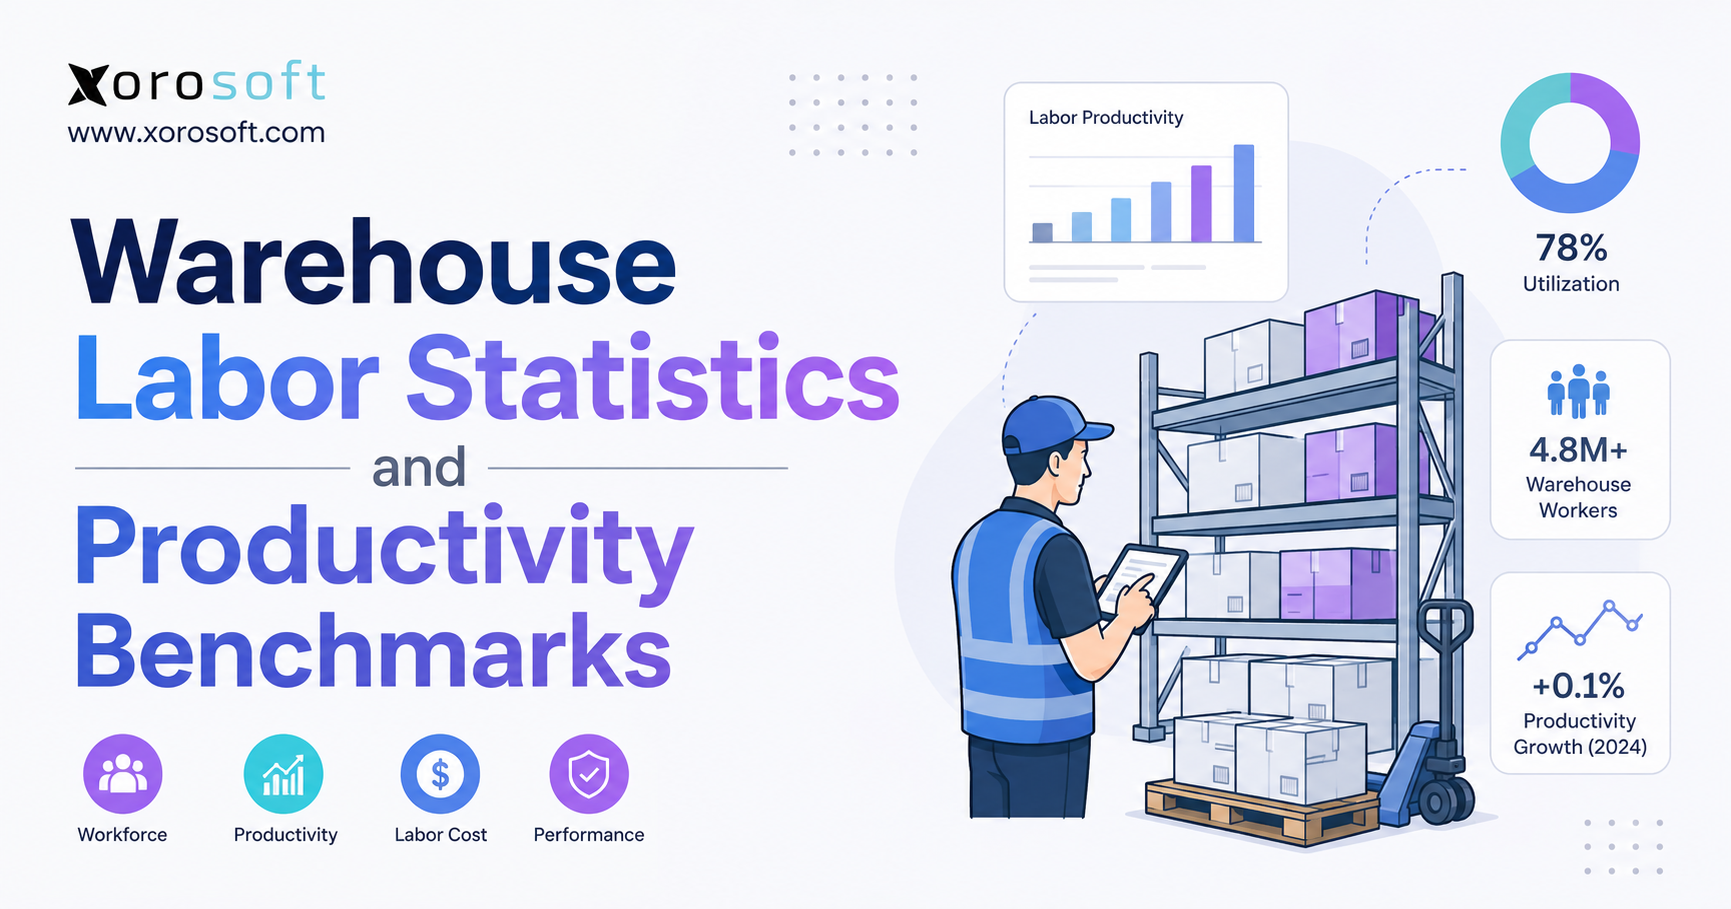
When examining warehouse labor statistics, it becomes clear how vital the workforce is to this industry.
1. Warehouse Labor Statistics Reveal a Growing Margin Problem
Warehouse labor issues rarely begin with an obvious staffing crisis. Instead, they appear through smaller signs. Receiving falls behind after a large delivery. Pickers wait for replenishment. Packing stations collect unfinished orders. Overtime becomes part of the normal schedule. Each issue may look manageable, yet together they raise fulfillment costs and reduce warehouse capacity.
That is why warehouse labor statistics matter to more than the warehouse manager. They affect finance, purchasing, inventory planning, customer service, and business growth. A company may hire more people and still miss service targets because employees spend too much time walking, searching, waiting, or correcting errors.
At the same time, a single productivity number can create the wrong conclusion. A high pick rate may look strong, but it loses value when accuracy falls. Likewise, a low order-per-hour rate may look weak even though the warehouse handles large, complex orders. Therefore, leaders need context before they use any benchmark.
Reliable warehouse labor statistics help managers answer five practical questions. How much work does each labor hour produce? Which process creates the largest delay? How much does labor cost per order, line, case, or pallet? Are safety, turnover, or overtime reducing capacity? Finally, does the current system give managers enough data to improve performance?
This guide explains those questions in plain language. It reviews current workforce data, process benchmarks, cost formulas, industry differences, and practical improvement steps. More importantly, it shows how to use warehouse labor statistics without turning them into unsafe or unrealistic quotas.
2. What Warehouse Labor Statistics Actually Measure
Warehouse labor productivity measures the output completed for each unit of labor input.
Warehouse labor productivity = Total warehouse output ÷ Total labor hours
The formula looks simple. However, the result depends on how the business defines output and labor. A direct-to-consumer warehouse may track lines or units per hour. A wholesale distributor may track cases or pallets. A furniture warehouse may need to track cubic volume, two-person moves, or completed delivery sets.
Because every warehouse handles different work, leaders should avoid one universal target. Instead, they should compare similar processes, products, order types, and labor definitions.
2.1 Warehouse Productivity, Efficiency, and Utilization Measure Different Results
Many teams use productivity, efficiency, and utilization as if they mean the same thing. In practice, each measure answers a different question.
| Measure | Question it answers | Example |
|---|---|---|
| Productivity | How much output did the team complete per labor hour? | 80 lines picked per hour |
| Efficiency | How did actual performance compare with the expected standard? | 94% of standard |
| Utilization | How much paid time supported useful work? | 82% productive time |
| Effectiveness | Did the process create the right business result? | Orders shipped accurately and on time |
For example, a picker may complete many lines per hour but also create more errors. In that case, productivity rises while effectiveness falls. Similarly, a team may show high utilization because employees remain busy, but their work may include avoidable travel or repeated corrections.
Therefore, warehouse labor statistics should always sit beside quality measures. Managers should review output with accuracy, damage, rework, safety, overtime, and customer service.
2.2 Direct and Indirect Warehouse Labor Change the Benchmark
Direct labor includes work that moves inventory or completes orders. Common examples include receiving, putaway, replenishment, picking, packing, shipping, returns, and cycle counting.
Indirect labor includes training, meetings, cleaning, equipment checks, waiting, searching, correcting errors, and handling system problems. Both types matter because the company pays for both.
A warehouse that counts only direct hours will report a stronger productivity rate than a warehouse that counts all paid hours. Neither method is automatically wrong. However, the company must use the same method across sites, teams, and time periods.
For that reason, each KPI should include a clear definition. The definition should explain the output unit, the labor hours included, the exclusions, the source system, and the reporting period. Once the definitions stay consistent, warehouse labor statistics become much easier to trust.
2.3 Warehouse Labor Benchmarks Must Match the Operating Model
WERC separates warehouse activity by broken-case, full-case, partial-pallet, and full-pallet work. It also separates ecommerce, wholesale, grocery, regional, local, and omnichannel facilities. This approach reflects a simple fact: warehouse work changes by operating model.
A broken-case picker may walk through several aisles to collect small items. A full-pallet operator may use a forklift and complete fewer tasks, yet move far more volume. A furniture employee may need help from a second person. A food warehouse may add lot, expiry, and temperature checks.
As a result, useful warehouse labor statistics compare like with like. The warehouse should match product size, order profile, picking method, automation level, accuracy rules, and labor definitions before it sets a target.
3. Core Warehouse Labor Statistics for 2026
Current workforce data shows the scale and cost of warehouse operations. The U.S. warehousing and storage sector employed about 1.851 million people in June 2026, based on preliminary seasonally adjusted data from the Bureau of Labor Statistics. The sector included large groups of stock clerks, order fillers, material movers, forklift operators, and shipping staff.
These warehouse labor statistics show why small process gains can create large savings. If a warehouse employs 100 people, five minutes of wasted time per person per shift can add up to hundreds of paid hours over a year.
3.1 Warehouse Employment and Wage Statistics
Average hourly earnings for all warehousing and storage employees reached about $26.76 in May 2026. Production and nonsupervisory employees averaged about $26.30 per hour. However, the actual cost to the employer is higher because wages represent only one part of labor cost.
The company also pays employer taxes, benefits, overtime, training, paid leave, workers’ compensation, and staffing fees. Therefore, managers should not use hourly wages alone when they assess labor cost per order or labor cost per unit.
| Warehouse labor statistic | Current reference point | Why it matters |
| Warehousing and storage employment | About 1.851 million | Shows the size of the workforce |
| Average hourly earnings | About $26.76 | Shows direct labor cost pressure |
| Nonsupervisory hourly earnings | About $26.30 | Gives a closer view of frontline cost |
| Stock clerks and order fillers | More than 457,000 jobs | Represents a large fulfillment role |
| Material movers | More than 433,000 jobs | Shows continued reliance on manual work |
| Total recordable incident rate | 4.8 per 100 workers | Connects safety with productivity |
| Labor productivity growth | 0.1% in 2024 | Shows limited recent sector gains |
3.2 Warehouse Safety Statistics Belong in the Same Dashboard
In 2024, the warehousing and storage sector recorded 4.8 total recordable injury and illness cases per 100 full-time workers. Cases that involved days away, job restriction, or transfer reached 4.1 per 100 workers.
These numbers matter because safety problems reduce available labor. Injuries can create absence, restricted duty, overtime, training needs, and higher insurance costs. In addition, unsafe speed targets can increase fatigue and turnover.
Therefore, leaders should review warehouse labor statistics with safety measures. A rate is not truly better when it produces more output but also causes more injuries, damage, or employee exits.
3.3 Warehouse Productivity Growth Has Remained Limited
At the industry level, labor productivity grew only 0.1% in 2024 after several weaker years. This broad measure does not tell a manager how many lines a picker should complete. Still, it suggests that the sector continues to face limits in process design, staffing, technology, and demand control.
For that reason, companies should not wait for the market to solve the problem. They need their own warehouse labor statistics, their own baseline, and a clear plan for improvement.
4. Warehouse Productivity Benchmarks by Process
A warehouse-wide average can hide the real bottleneck. Picking may look strong while packing falls behind. Receiving may move quickly but create bad inventory records. Replenishment may save labor in one area while forcing pickers to wait.
Therefore, managers should measure each process on its own and then study how the processes affect one another.
4.1 Receiving Productivity Benchmarks
Receiving productivity can use receipts, purchase-order lines, cases, or pallets per labor hour.
Receiving productivity = Total receiving output ÷ Receiving labor hours
The right output depends on the work. A pallet warehouse may use pallets unloaded per hour. A mixed-carton warehouse may use lines or cases. A food warehouse may also track lot capture and quality checks.
Receiving performance depends on supplier labels, purchase-order accuracy, appointment planning, advance shipping notices, inspection rules, and product type. When suppliers send poor data, receivers must stop and investigate.
Fast receiving does not always mean good receiving. If employees skip checks or place stock in the wrong location, the business pays for the error later through searches, recounts, short picks, and finance adjustments.
4.2 Putaway and Replenishment Productivity Benchmarks
Putaway productivity may use lines, cases, or pallets stored per hour. However, managers should also track correct-location percentage and dock-to-stock time.
Replenishment productivity may use tasks or cases per hour. Yet emergency replenishment percentage often gives a clearer view of the problem. Emergency tasks interrupt planned work and delay picking.
For example, when a forward-pick location runs empty, a picker may stop, move to another order, or wait for stock. At the same time, the replenishment team must change priorities. One shortage affects two labor groups.
Therefore, warehouse labor statistics should connect replenishment output with pick delays, stockouts, and urgent tasks. That broader view helps managers fix the cause instead of only measuring the response.
4.3 Warehouse Picking Productivity Benchmarks
Picking remains one of the most watched warehouse processes. Common measures include units per hour, lines per person-hour, orders per person-hour, cases per hour, pallets per hour, and travel time per order.
Descartes reported an average of 23.50 orders picked per hour per person across its Peoplevox customer data for a pick-and-sort-to-trolley method. However, sector results varied widely. That variation shows why managers should use the number as context, not as a universal target.
A picker who completes 25 one-line orders does less physical work than a picker who completes 25 orders with ten lines each. Likewise, a pallet picker may complete fewer tasks while moving far more value and volume.
For most operations, lines per person-hour provides a more stable measure than orders per hour. Units per labor hour can help when line quantities vary. Still, the warehouse should separate discrete picking, batch picking, zone picking, wave picking, case picking, and pallet picking.
| Picking method | Best output measure | Main factor |
| Discrete picking | Lines or units per hour | Travel distance |
| Batch picking | Lines or orders per hour | Batch size and sort work |
| Zone picking | Zone tasks or lines per hour | Balance between zones |
| Case picking | Cases per hour | Weight and handling method |
| Pallet picking | Pallets per hour | Forklift travel and staging |
| Wave picking | Orders completed by cutoff | Release timing |
4.4 Packing Productivity Benchmarks
Packing teams often track orders packed per hour, units packed per hour, average pack time, packaging cost, repack rate, and label errors.
Order complexity changes the result. A single durable item may take less than a minute to pack. In contrast, a fragile order with several items, custom material, or export documents can take much longer.
Because of that difference, packing benchmarks should separate simple, standard, fragile, custom, and international orders. Managers should also connect packing output with picking volume. Otherwise, the picking team may create a large backlog that hides at the pack stations.
4.5 Shipping, Returns, and Cycle-Count Benchmarks
Shipping teams can measure orders shipped per labor hour, pallets staged per hour, trailer load time, carrier cutoff success, and mis-ship rate. These measures should show both speed and completion quality.
Returns teams should track returns processed per hour, time to final action, percentage returned to available stock, and adjustment rate. Slow returns work locks up inventory and delays resale.
Inventory teams may measure locations or SKUs counted per hour. However, count speed loses value when the team creates more recounts or incorrect adjustments.
A connected cloud warehouse management system can bring these process measures together. For example, Xorosoft can connect receiving, putaway, replenishment, picking, packing, shipping, and inventory movement so managers can see how one area affects another.
5. Warehouse Labor Cost Benchmarks and Margin Impact
Warehouse labor statistics become more useful when the business connects them to cost. A higher output rate matters because it can lower cost per unit, order, case, or pallet. However, the company must use a full labor cost, not just the hourly wage.
5.1 Fully Loaded Warehouse Labor Cost
Fully loaded labor cost = Wages + employer taxes + benefits + overtime + staffing fees + other labor expenses
Suppose an employee earns $22 per hour. The true cost may be much higher after the company adds payroll taxes, benefits, overtime, training, and paid nonproductive time.
Finance should help define the loaded rate. Once the company uses a trusted rate, operations can compare labor cost across processes, shifts, channels, and warehouses.
5.2 Warehouse Labor Cost per Order
Labor cost per order = Total warehouse labor cost ÷ Total orders processed
If a warehouse spends $150,000 on labor in one month and processes 50,000 orders, labor cost per order equals $3.00.
However, managers should not stop there. They should also calculate labor cost per line, case, pallet, or unit. An order count can mislead when one channel has small orders and another has large ones.
In addition, the business should watch changes in order mix. Labor cost per order may fall because the team improved. It may also fall because customers ordered fewer units per order. Therefore, the company should review volume, order size, and service level together.
5.3 Overtime Percentage Shows Hidden Process Stress
Overtime percentage = Overtime hours ÷ Total labor hours × 100
Planned overtime can help during a seasonal peak. Persistent overtime usually points to a deeper issue.
The warehouse may face weak demand planning, late receiving, bad inventory data, poor replenishment, unbalanced shifts, or too much manual work. In that case, hiring more people may only add cost without fixing the cause.
Warehouse labor statistics should show overtime by shift, process, and site. That detail helps managers find where the pressure begins.
5.4 Turnover and Absence Reduce Available Capacity
Turnover affects more than recruitment. New employees need training and support. Supervisors spend more time helping new hires. Experienced employees may correct more mistakes.
A warehouse should measure annual turnover, 90-day turnover, and turnover by role, shift, supervisor, and employment type.
Absence creates similar pressure. When a team loses workers without notice, other employees take on more work. Overtime rises, backlogs grow, and quality may fall.
As a result, warehouse labor statistics should include turnover and absence beside output. They help managers understand why a team with enough headcount may still lack enough experienced capacity.
5.5 Connecting Labor Cost With Inventory and Finance
Operations can see where employees spend time. Finance can see what that time costs. When both teams use the same data, the company can link labor to margin, inventory value, and order profit.
A connected warehouse and inventory ERP can support that view. Xorosoft, for example, connects warehouse activity with inventory, purchasing, sales orders, accounting, and reporting for inventory-driven businesses.
6. Warehouse Labor Statistics Change by Industry and Order Type
A useful benchmark must match the work. Ecommerce, wholesale, manufacturing, apparel, furniture, and food warehouses all create different labor demands.
6.1 Ecommerce Warehouse Productivity Benchmarks
Ecommerce warehouses often process many small orders. They also face parcel cutoffs, fast delivery promises, broad SKU ranges, and high return volume.
Orders per hour may work when order sizes stay consistent. However, lines or units per hour usually give a fairer comparison when basket sizes change.
For Shopify merchants, system flow also affects warehouse labor. Orders should enter the warehouse without manual re-entry. Inventory should update quickly. Shipment details should return to the storefront.
Xorosoft can work as the operating system behind Shopify by connecting orders with inventory, purchasing, warehouse execution, accounting, and forecasting. Merchants can also review the Xorosoft ERP listing in the Shopify App Store.
6.2 Wholesale Warehouse Productivity Benchmarks
Wholesale warehouses often handle full cases, mixed pallets, retail labels, EDI documents, and delivery windows. Because each order may include large volumes, orders per hour can create the wrong picture.
Cases per labor hour, pallets per hour, lines per person-hour, fill rate, and on-time ready-to-ship performance often work better.
Wholesale teams should also track special handling. Customer labels, compliance documents, allocation, and backorders add labor even when the physical pick looks simple.
6.3 Manufacturing Warehouse Labor Benchmarks
Manufacturing warehouses support production. Their work includes raw-material receiving, component picking, work-order staging, internal moves, and finished-goods putaway.
A high pick rate does not help when the wrong part reaches production. Therefore, managers should also track staging accuracy, line shortages, material availability, and production delays caused by inventory.
These warehouse labor statistics connect warehouse performance with factory output. They help managers see whether the warehouse supports production or becomes a hidden constraint.
6.4 Apparel, Furniture, and Food Warehouse Benchmarks
Apparel warehouses manage many size, color, and style combinations. They often handle seasonal demand, high return rates, and both wholesale and direct-to-consumer orders.
Furniture warehouses handle large, fragile, or irregular items. They may need two-person moves, special equipment, and more space. Units per hour alone will not describe the work fairly.
Food and beverage warehouses may add lot checks, expiry control, temperature checks, and first-expired-first-out rules. These steps protect quality and traceability, even though they add time.
Businesses can review Xorosoft’s industry solutions to see how warehouse, purchasing, inventory, manufacturing, and accounting needs change across sectors.
7. Why Warehouse Labor Productivity Falls
Low productivity does not always mean employees work slowly. Often, employees work hard inside a poor process.
7.1 Poor Slotting Increases Travel
Fast-moving items should sit near the work area that uses them most. When high-volume SKUs sit far away, pickers spend more time walking or driving.
Slotting should use sales speed, product size, weight, order links, and replenishment needs. The warehouse should also update slotting when demand changes.
7.2 Inaccurate Inventory Creates Search Time
When the system shows the wrong quantity or location, employees search, recount, short-pick, or request help. None of that work creates planned output.
Inventory errors also affect purchasing, customer service, and finance. Therefore, improving accuracy often raises labor productivity across several teams.
7.3 Weak Replenishment Interrupts Picking
Empty pick faces force employees to wait or skip orders. Emergency replenishment then pulls another worker away from planned work.
Better minimum levels and demand signals help teams replenish before the shortage reaches the picker.
7.4 Manual Work Adds Hidden Labor
Paper lists, spreadsheets, retyped orders, and manual labels add steps. They also reduce visibility because managers cannot see clear task times or delays.
As a result, the business may know that labor cost increased but not know which process caused it.
7.5 Disconnected Systems Hide the Root Cause
A growing company may use Shopify, QuickBooks, spreadsheets, an inventory app, a warehouse app, and an EDI tool. Each system may work on its own, but the handoffs create duplicate entry and delayed updates.
Employees then spend time reconciling data instead of moving inventory. This indirect labor often grows quietly as order volume increases.
8. How to Improve Warehouse Labor Productivity
The best improvement programs remove wasted work. They do not simply push employees to move faster.
8.1 Fix Flow Before Raising Targets
Managers should first review travel, layout, replenishment, inventory accuracy, equipment, and workload release.
When the process becomes easier, employees can complete more work without more strain. In contrast, higher targets inside the same poor process can increase errors and turnover.
8.2 Use Barcode Scanning With a Clear Purpose
Barcode scanning can confirm the item, location, quantity, order, lot, serial number, or shipment.
However, every scan should serve a clear purpose. Too many scans add steps. Too few scans allow errors. The workflow should use scanning where it prevents a costly mistake or captures a useful event.
8.3 Balance Labor Across Work Queues
A warehouse may have enough total staff but still miss deadlines because employees work in the wrong area.
Real-time queue data helps supervisors see whether receiving, picking, packing, or shipping needs help. Cross-trained workers can then move before the backlog becomes severe.
8.4 Improve Replenishment With Demand Signals
Replenishment should use current stock, open orders, expected demand, and minimum location levels. This approach allows the team to plan work and reduce urgent tasks.
As a result, pickers face fewer empty locations, and replenishment workers spend less time reacting.
8.5 Use Warehouse Labor Statistics in Real Time
Monthly reports help with trends, but supervisors need faster signals. A real-time view can show open tasks, output, delays, and exceptions by process or site.
A connected cloud ERP platform such as Xorosoft can bring warehouse, inventory, purchasing, accounting, forecasting, manufacturing, and ecommerce data into one system.
This shared view helps managers act sooner. It also reduces the time teams spend building reports by hand.
8.6 Pair Every Speed Metric With a Quality Metric
Lines picked per hour should sit beside pick accuracy. Orders packed per hour should sit beside pack errors. Receipts per hour should sit beside receiving accuracy.
This simple rule keeps warehouse labor statistics useful. It prevents the team from improving one number while harming the final result.
9. When Better Warehouse Software Becomes Necessary
Not every problem needs new software. A poor layout still needs a layout fix. Weak training still needs better management.
Software becomes necessary when the business cannot see, direct, or connect the work.
9.1 A WMS Improves Warehouse Execution
A warehouse management system can direct receiving, putaway, replenishment, picking, packing, shipping, transfers, and counts.
It can also capture scans, task times, and location changes. As a result, managers gain better data and employees receive clearer work steps.
However, a WMS will not repair poor master data or unclear processes on its own. The business still needs clean item data, clear rules, and strong training.
9.2 ERP Connects Warehouse Work With the Rest of the Business
An ERP becomes more useful when warehouse problems connect with purchasing, sales, inventory, accounting, forecasting, manufacturing, ecommerce, or EDI.
For example, weak buying decisions can create excess receiving and storage work. Poor forecasts can cause stockouts and urgent replenishment. Slow inventory updates can delay finance reports.
An integrated ERP helps teams solve the full problem instead of improving one department in isolation.
9.3 Compare ERP and WMS Options by Fit
Inventory-driven companies may compare NetSuite, Acumatica, Microsoft Dynamics 365 Business Central, Sage, Cin7, Brightpearl, Fishbowl, and other systems.
The right choice depends on warehouse depth, accounting needs, ecommerce links, manufacturing, reporting, cost, and implementation effort.
Xorosoft serves as a modern ERP option for companies that have outgrown QuickBooks, spreadsheets, inventory-only tools, or disconnected warehouse systems. Businesses that want to compare larger suites can use this Xorosoft versus NetSuite guide as part of their review.
10. A 90-Day Warehouse Labor Benchmarking Plan
Warehouse labor statistics become useful when the company turns them into a repeatable process. A 90-day plan gives the team enough time to set definitions, build a baseline, study differences, and test changes.
10.1 Weeks 1–2: Define the Measures
Choose a small group of important KPIs. For most warehouses, that means one output and one quality measure for receiving, picking, packing, and shipping.
Also add labor cost, overtime, inventory accuracy, and safety.
Write down the formula, output unit, included labor, exclusions, owner, and reporting frequency for each metric.
10.2 Weeks 3–6: Build the Baseline
Collect data from normal operating weeks. Separate peak events, large promotions, inventory counts, and system problems.
Review both averages and medians. Averages may change because of a few unusual days. Medians often show the normal result more clearly.
10.3 Weeks 7–10: Segment the Data
Compare results by shift, zone, product type, order type, picking method, employee experience, and warehouse.
The goal is not to rank employees without context. Instead, the goal is to find where the process changes and why.
10.4 Weeks 11–13: Test One Change at a Time
Re-slot one product group, change one replenishment rule, adjust one batch size, or add scanning to one step.
Then measure output, accuracy, overtime, and service. Expand the change only when the whole result improves.
11. Warehouse Labor Statistics FAQs
11.1 What are warehouse labor statistics?
Warehouse labor statistics describe employment, wages, productivity, cost, turnover, absence, safety, and other workforce results in warehouse operations. Companies use them to compare performance, plan staffing, control cost, and find process problems.
11.2 How do you calculate warehouse labor productivity?
Divide total output by total labor hours. For example, if a team picks 8,000 lines in 100 hours, productivity equals 80 lines per labor hour.
11.3 What is a good warehouse productivity rate?
A good rate compares well with similar operations while protecting accuracy, safety, cost, and service. No single target works for every warehouse.
11.4 How many orders should a picker complete per hour?
The answer depends on order size, product type, travel distance, picking method, and system steps. Managers should compare similar orders and similar workflows.
11.5 Is lines per hour better than orders per hour?
Often, yes. Lines per hour gives a fairer view when some orders contain one line and others contain many lines.
11.6 What is units per labor hour?
Units per labor hour measures how many items a team processes for each hour of labor. Warehouses can use it for receiving, picking, packing, or other work.
11.7 What are the main warehouse labor KPIs?
Common KPIs include lines per hour, units per hour, orders per hour, labor cost per order, overtime, utilization, turnover, absence, accuracy, and safety.
11.8 What is warehouse labor utilization?
Labor utilization shows the share of paid time spent on useful work. The company should define which direct and indirect tasks count.
11.9 What is the difference between productivity and efficiency?
Productivity measures output per hour. Efficiency compares actual performance with an expected standard.
11.10 How do you calculate warehouse labor cost per order?
Divide total warehouse labor cost by the number of orders processed during the same period.
11.11 What is fully loaded warehouse labor cost?
It includes wages, employer taxes, benefits, overtime, staffing fees, training, and other labor expenses.
11.12 What is a reasonable overtime percentage?
No single percentage fits every warehouse. Short-term overtime can support peaks, but ongoing overtime often signals a process or staffing problem.
11.13 How does inventory accuracy affect productivity?
Bad inventory data creates searching, recounts, short picks, urgent replenishment, and customer service work. All of those tasks use labor without creating planned output.
11.14 Why does warehouse productivity fall during growth?
Growth adds more orders, SKUs, returns, receiving, and coordination. Old processes often fail when volume and complexity rise.
11.15 How does turnover affect warehouse productivity?
Turnover reduces experienced capacity. New hires need training, while supervisors and senior workers spend more time helping them.
11.16 How does absence affect warehouse performance?
Absence creates gaps in key areas. It can raise overtime, delay orders, and reduce quality.
11.17 Does barcode scanning improve productivity?
Yes, when the workflow uses it well. Scanning can reduce search time, wrong picks, manual entry, and rework.
11.18 Does automation reduce warehouse labor cost?
It can, but only when volume, process stability, use, maintenance, and cost support the investment.
11.19 Can a WMS improve warehouse labor productivity?
Yes. A WMS can direct tasks, improve location control, capture scans, and show work queues. Results still depend on process design and training.
11.20 How do ecommerce and wholesale benchmarks differ?
Ecommerce often uses small parcel orders. Wholesale often uses cases and pallets. Therefore, the two models need different measures.
11.21 Should productivity targets include accuracy?
Yes. Faster work loses value when errors, damages, returns, or complaints increase.
11.22 How often should warehouse KPIs be reviewed?
Supervisors may review them daily, managers weekly, and leaders monthly. Teams should also review target definitions every quarter.
11.23 When does a warehouse need labor management software?
It becomes useful when the operation has several shifts, high labor cost, detailed standards, and a need for task-level data.
11.24 When should a business implement a WMS?
A WMS becomes useful when inventory locations, order volume, multiple warehouses, scanning, or fulfillment complexity exceed the current process.
11.25 When should a business implement ERP?
ERP becomes useful when warehouse work must connect with purchasing, accounting, forecasting, manufacturing, ecommerce, and EDI.
12. Turn Warehouse Labor Statistics Into a Better Operating Plan
Warehouse labor statistics provide useful context, but internal data should guide the final decision. The highest number in a report is not always the right target. Instead, managers should use comparable data that reflects their products, orders, methods, and service goals.
First, define each process clearly. Measure receiving, putaway, replenishment, picking, packing, shipping, returns, and counting on their own. Next, use the same labor rules across teams and periods. Then, pair every speed measure with accuracy, cost, safety, and service.
After that, find the root cause. The problem may come from layout, poor inventory data, weak training, bad replenishment, or disconnected systems. Fix the cause before raising the target.
Finally, review whether the business has enough system support. Companies that need warehouse labor statistics connected with inventory, purchasing, accounting, forecasting, ecommerce, manufacturing, and multiple locations may benefit from an integrated ERP and WMS approach.
To review your warehouse structure, current systems, reporting gaps, and growth plans, contact Xorosoft for a personalized discussion.